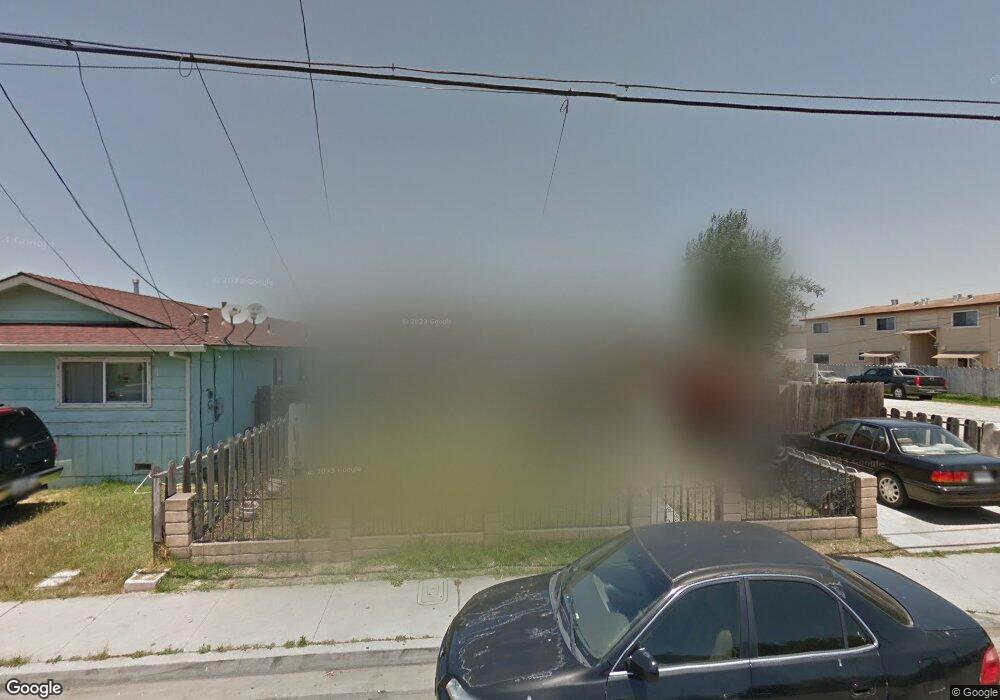
537 Fremont St Salinas, CA 93905
East Salinas NeighborhoodEstimated Value: $530,000 - $619,000
3
Beds
1
Bath
992
Sq Ft
$578/Sq Ft
Est. Value
About This Home
This home is located at 537 Fremont St, Salinas, CA 93905 and is currently estimated at $573,042, approximately $577 per square foot. 537 Fremont St is a home located in Monterey County with nearby schools including Sherwood Elementary School, Los Padres Elementary School, and Washington Middle School.
Ownership History
Date
Name
Owned For
Owner Type
Purchase Details
Closed on
May 23, 2006
Sold by
Perez Carlos U
Bought by
Perez Carlos Uriate and Perez Luz Elba
Current Estimated Value
Purchase Details
Closed on
Jul 22, 2002
Sold by
Perez Bertha
Bought by
Perez Carlos U
Purchase Details
Closed on
Feb 11, 2000
Sold by
Perez Roberto
Bought by
Perez Bertha
Create a Home Valuation Report for This Property
The Home Valuation Report is an in-depth analysis detailing your home's value as well as a comparison with similar homes in the area
Home Values in the Area
Average Home Value in this Area
Purchase History
| Date | Buyer | Sale Price | Title Company |
|---|---|---|---|
| Perez Carlos Uriate | -- | None Available | |
| Perez Carlos U | -- | First American Title | |
| Perez Bertha | -- | Fidelity National Title Co |
Source: Public Records
Tax History Compared to Growth
Tax History
| Year | Tax Paid | Tax Assessment Tax Assessment Total Assessment is a certain percentage of the fair market value that is determined by local assessors to be the total taxable value of land and additions on the property. | Land | Improvement |
|---|---|---|---|---|
| 2025 | $1,483 | $125,474 | $85,358 | $40,116 |
| 2024 | $1,483 | $123,015 | $83,685 | $39,330 |
| 2023 | $1,434 | $120,604 | $82,045 | $38,559 |
| 2022 | $1,379 | $118,240 | $80,437 | $37,803 |
| 2021 | $1,325 | $115,922 | $78,860 | $37,062 |
| 2020 | $1,289 | $114,734 | $78,052 | $36,682 |
| 2019 | $1,278 | $112,485 | $76,522 | $35,963 |
| 2018 | $1,259 | $110,280 | $75,022 | $35,258 |
| 2017 | $1,260 | $108,118 | $73,551 | $34,567 |
| 2016 | $1,261 | $105,999 | $72,109 | $33,890 |
| 2015 | $1,271 | $104,407 | $71,026 | $33,381 |
| 2014 | $1,188 | $102,363 | $69,635 | $32,728 |
Source: Public Records
Map
Nearby Homes
- 487 E Market St
- 150 Kern St Unit 39
- 150 Kern St Unit 40
- 150 Kern St Unit 92
- 166 Kern St Unit 19
- 166 Kern St Unit 26
- 75 S Madeira Ave
- 840 N Madeira Ave
- 11 Hill Cir
- 916 Acosta Plaza Unit 23
- 916 Acosta Plaza Unit 15
- 17 Williams Rd
- 914 Acosta Plaza Unit 94
- 914 Acosta Plaza Unit 111
- 914 Acosta Plaza Unit 91
- 1 Santa Lucia Ave
- 912 Acosta Plaza Unit 11
- 230 Martella St
- 453 Carol Dr
- 15 Saint Francis Way