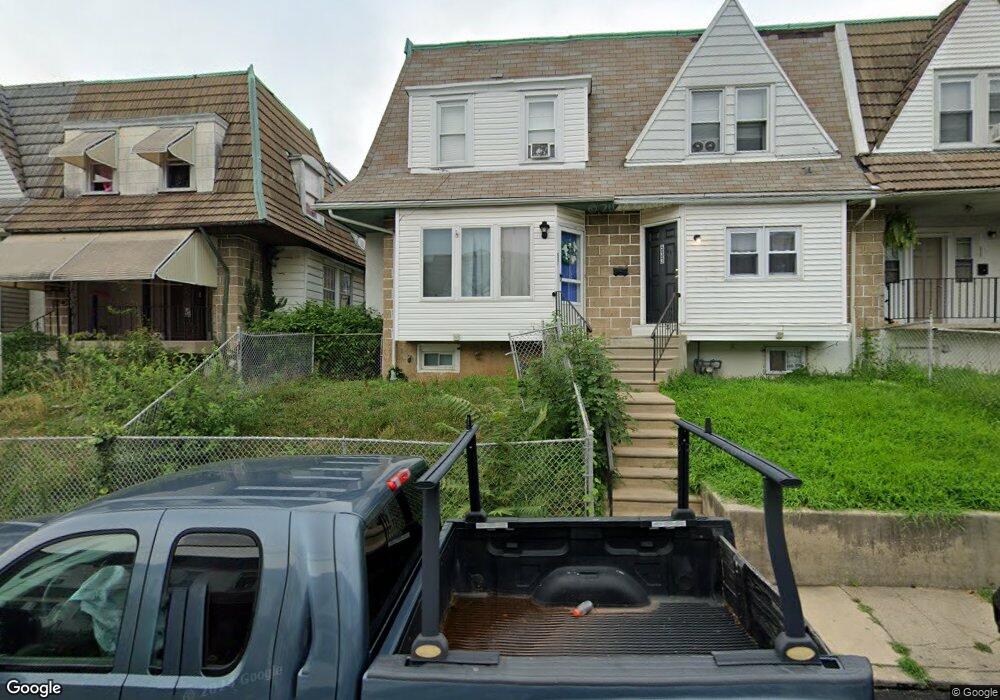
537 Hampden Rd Upper Darby, PA 19082
Estimated Value: $166,000 - $203,000
4
Beds
2
Baths
1,093
Sq Ft
$166/Sq Ft
Est. Value
About This Home
This home is located at 537 Hampden Rd, Upper Darby, PA 19082 and is currently estimated at $181,667, approximately $166 per square foot. 537 Hampden Rd is a home located in Delaware County with nearby schools including Upper Darby Kdg Center, Upper Darby High School, and Vision Academy Charter School.
Ownership History
Date
Name
Owned For
Owner Type
Purchase Details
Closed on
Mar 18, 2024
Sold by
Jjl Faithful Llc
Bought by
Jjl Faithful Investment Llc
Current Estimated Value
Purchase Details
Closed on
Mar 14, 2022
Sold by
Unknown
Bought by
Jjl Faithful Llc
Home Financials for this Owner
Home Financials are based on the most recent Mortgage that was taken out on this home.
Original Mortgage
$92,000
Interest Rate
3.85%
Mortgage Type
New Conventional
Purchase Details
Closed on
Feb 16, 2017
Sold by
Upper Darby Rentals Llc
Bought by
Antonopoulos George
Purchase Details
Closed on
Apr 8, 2016
Sold by
Lowther Thomas William and Lowther Genevieve A
Bought by
Upper Darby Rentals Llc
Purchase Details
Closed on
Nov 18, 1954
Bought by
Lowther Thos Wm and Lowther G
Create a Home Valuation Report for This Property
The Home Valuation Report is an in-depth analysis detailing your home's value as well as a comparison with similar homes in the area
Home Values in the Area
Average Home Value in this Area
Purchase History
| Date | Buyer | Sale Price | Title Company |
|---|---|---|---|
| Jjl Faithful Investment Llc | -- | None Listed On Document | |
| Jjl Faithful Llc | $87,000 | None Listed On Document | |
| Antonopoulos George | $24,000 | None Available | |
| Upper Darby Rentals Llc | $10,425 | None Available | |
| Lowther Thos Wm | -- | -- |
Source: Public Records
Mortgage History
| Date | Status | Borrower | Loan Amount |
|---|---|---|---|
| Previous Owner | Jjl Faithful Llc | $92,000 |
Source: Public Records
Tax History Compared to Growth
Tax History
| Year | Tax Paid | Tax Assessment Tax Assessment Total Assessment is a certain percentage of the fair market value that is determined by local assessors to be the total taxable value of land and additions on the property. | Land | Improvement |
|---|---|---|---|---|
| 2025 | $2,126 | $50,280 | $13,450 | $36,830 |
| 2024 | $2,126 | $50,280 | $13,450 | $36,830 |
| 2023 | $2,106 | $50,280 | $13,450 | $36,830 |
| 2022 | $2,050 | $50,280 | $13,450 | $36,830 |
| 2021 | $2,764 | $50,280 | $13,450 | $36,830 |
| 2020 | $2,716 | $41,980 | $12,230 | $29,750 |
| 2019 | $2,668 | $41,980 | $12,230 | $29,750 |
| 2018 | $2,637 | $41,980 | $0 | $0 |
| 2017 | $2,569 | $41,980 | $0 | $0 |
| 2016 | $230 | $41,980 | $0 | $0 |
| 2015 | $235 | $41,980 | $0 | $0 |
| 2014 | $235 | $41,980 | $0 | $0 |
Source: Public Records
Map
Nearby Homes
- 418 Hampden Rd
- 506 Hampden Rd
- 414 Glendale Rd
- 424 Woodcliffe Rd
- 346 Long Ln
- 504 Woodcliffe Rd
- 513 Woodcliffe Rd
- 432 Grace Rd
- 7139 Guilford Rd
- 351 Long Ln
- 7114 Locust St
- 607 Littlecroft Rd
- 404 Croyden Rd
- 268 Hampden Rd
- 7249 Guilford Rd
- 517 Wiltshire Rd
- 669 Long Ln
- 525 Wiltshire Rd
- 7216 Clinton Rd
- 40 Lamport Rd