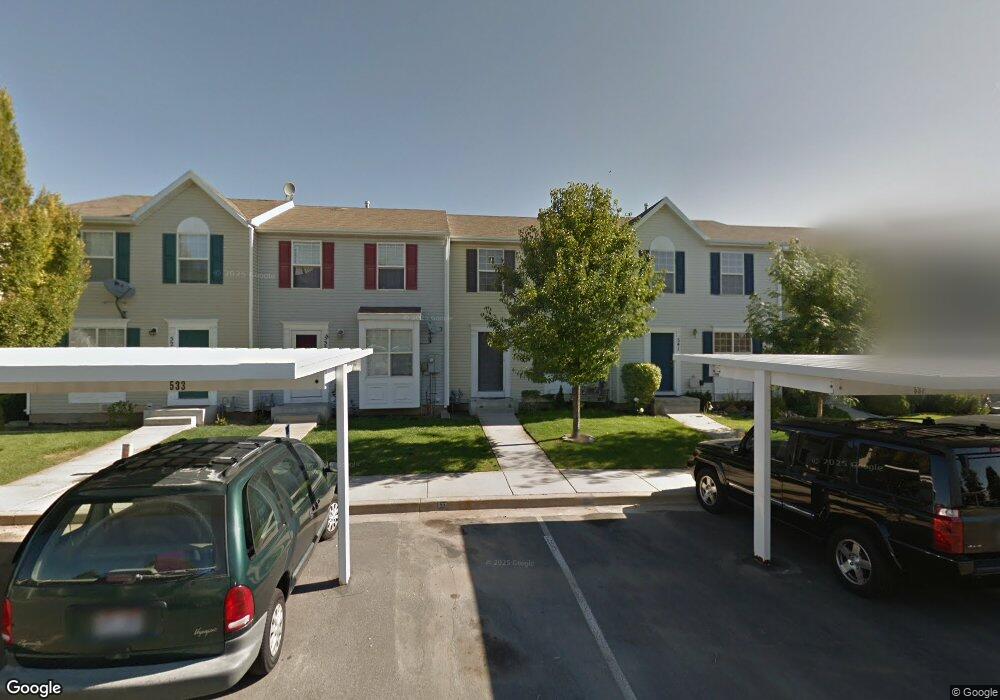
537 S 450 E Clearfield, UT 84015
Estimated Value: $316,000 - $342,000
4
Beds
3
Baths
1,676
Sq Ft
$196/Sq Ft
Est. Value
About This Home
This home is located at 537 S 450 E, Clearfield, UT 84015 and is currently estimated at $328,122, approximately $195 per square foot. 537 S 450 E is a home located in Davis County with nearby schools including South Clearfield Elementary School, North Davis Junior High School, and Clearfield High School.
Ownership History
Date
Name
Owned For
Owner Type
Purchase Details
Closed on
Jul 21, 2021
Sold by
Redford Jordan James and Redford Jessica Cristina
Bought by
Redford Jordan James and Redford Jessica Cristina
Current Estimated Value
Home Financials for this Owner
Home Financials are based on the most recent Mortgage that was taken out on this home.
Original Mortgage
$216,000
Outstanding Balance
$196,166
Interest Rate
2.96%
Mortgage Type
New Conventional
Estimated Equity
$131,956
Purchase Details
Closed on
Aug 1, 2019
Sold by
Taylor Nicholas K and Taylor Lindsey R
Bought by
Redford Jordan James and Redford Jessica Christina
Home Financials for this Owner
Home Financials are based on the most recent Mortgage that was taken out on this home.
Original Mortgage
$12,043
Interest Rate
3.7%
Mortgage Type
Stand Alone Second
Purchase Details
Closed on
Mar 30, 2017
Sold by
Mortensen Ryan B
Bought by
Taylor Nicholas K and Taylor Lindsey R
Home Financials for this Owner
Home Financials are based on the most recent Mortgage that was taken out on this home.
Original Mortgage
$81,600
Interest Rate
4.1%
Mortgage Type
New Conventional
Purchase Details
Closed on
Jun 24, 2013
Sold by
Pechetto Carlos Daniel and Olivera Patricia
Bought by
Mortensen Ryan B
Home Financials for this Owner
Home Financials are based on the most recent Mortgage that was taken out on this home.
Original Mortgage
$4,718
Interest Rate
3.48%
Mortgage Type
Stand Alone Second
Purchase Details
Closed on
Aug 29, 2005
Sold by
Cheminant Jared Le and Cheminant Jessica Le
Bought by
Pechetto Carlos Daniel and Olivera Patricia
Home Financials for this Owner
Home Financials are based on the most recent Mortgage that was taken out on this home.
Original Mortgage
$21,380
Interest Rate
5.76%
Mortgage Type
Stand Alone Second
Purchase Details
Closed on
Jun 21, 2001
Sold by
Mathison Jason D and Mathison Cheyenne K
Bought by
Lecheminant Jared and Lecheminant Jessica
Home Financials for this Owner
Home Financials are based on the most recent Mortgage that was taken out on this home.
Original Mortgage
$104,069
Interest Rate
7.14%
Mortgage Type
FHA
Purchase Details
Closed on
Sep 29, 1998
Sold by
Newcastle Greene Llc
Bought by
Mathison Jason D and Mathison Cheyenne K
Home Financials for this Owner
Home Financials are based on the most recent Mortgage that was taken out on this home.
Original Mortgage
$93,871
Interest Rate
6.88%
Mortgage Type
FHA
Create a Home Valuation Report for This Property
The Home Valuation Report is an in-depth analysis detailing your home's value as well as a comparison with similar homes in the area
Home Values in the Area
Average Home Value in this Area
Purchase History
| Date | Buyer | Sale Price | Title Company |
|---|---|---|---|
| Redford Jordan James | -- | Pinnacle Title Ins A | |
| Redford Jordan James | -- | Mountain View Title | |
| Taylor Nicholas K | -- | Security Title | |
| Mortensen Ryan B | -- | Inwest Title Services I | |
| Pechetto Carlos Daniel | -- | Equity Title Ins Agency Inc | |
| Lecheminant Jared | -- | American Preferred Title Llc | |
| Mathison Jason D | -- | First American Title Co |
Source: Public Records
Mortgage History
| Date | Status | Borrower | Loan Amount |
|---|---|---|---|
| Open | Redford Jordan James | $216,000 | |
| Closed | Redford Jordan James | $12,043 | |
| Closed | Redford Jordan James | $204,232 | |
| Previous Owner | Taylor Nicholas K | $81,600 | |
| Previous Owner | Mortensen Ryan B | $4,718 | |
| Previous Owner | Pechetto Carlos Daniel | $21,380 | |
| Previous Owner | Pechetto Carlos Daniel | $85,520 | |
| Previous Owner | Lecheminant Jared | $104,069 | |
| Previous Owner | Mathison Jason D | $93,871 |
Source: Public Records
Tax History
| Year | Tax Paid | Tax Assessment Tax Assessment Total Assessment is a certain percentage of the fair market value that is determined by local assessors to be the total taxable value of land and additions on the property. | Land | Improvement |
|---|---|---|---|---|
| 2025 | $1,737 | $155,650 | $58,300 | $97,350 |
| 2024 | $1,694 | $152,900 | $45,650 | $107,250 |
| 2023 | $1,696 | $281,000 | $72,000 | $209,000 |
| 2022 | $1,761 | $157,850 | $36,300 | $121,550 |
| 2021 | $1,514 | $205,000 | $48,000 | $157,000 |
| 2020 | $1,339 | $180,000 | $31,000 | $149,000 |
| 2019 | $1,243 | $165,000 | $35,000 | $130,000 |
| 2018 | $1,106 | $143,000 | $30,000 | $113,000 |
| 2016 | $960 | $64,900 | $14,300 | $50,600 |
| 2015 | $921 | $59,400 | $14,300 | $45,100 |
| 2014 | $945 | $61,748 | $18,333 | $43,415 |
| 2013 | -- | $63,258 | $12,650 | $50,608 |
Source: Public Records
Map
Nearby Homes
- 549 S 450 E
- 417 E 500 S
- 458 E Depot St
- 462 E 625 S
- 434 E Depot St
- 421 E Penny Ln
- 490 E 700 S Unit 524
- 490 E 700 S Unit C36
- 490 E 700 S Unit D42
- 490 E 700 S Unit D43
- 833 S Cowans Ct
- 462 E London Way Unit 30
- 288 S 500 E Unit 1
- 582 E 350 S
- 338 E 200 S
- 527 E 250 S
- 875 S Depot St Unit C307
- 875 S Depot St Unit A335
- 875 S Depot St Unit C301
- 875 S Depot St Unit B355
Your Personal Tour Guide
Ask me questions while you tour the home.