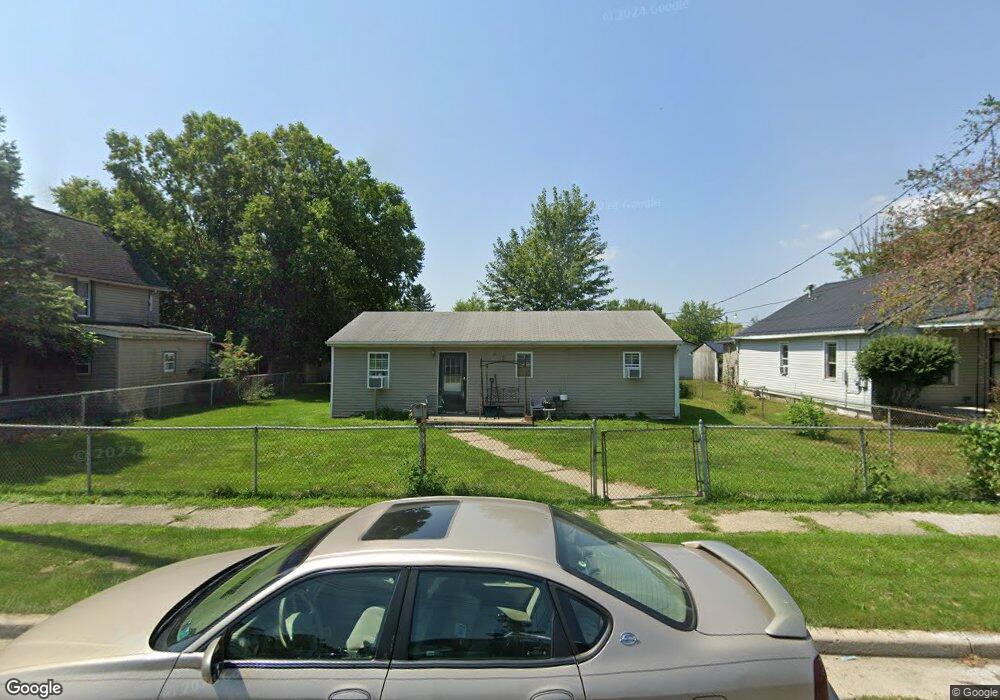
537 Thompson St Marion, OH 43302
Estimated Value: $85,000 - $131,000
3
Beds
1
Bath
960
Sq Ft
$110/Sq Ft
Est. Value
About This Home
This home is located at 537 Thompson St, Marion, OH 43302 and is currently estimated at $105,180, approximately $109 per square foot. 537 Thompson St is a home located in Marion County with nearby schools including Rutherford B. Hayes Elementary School, Ulysses S. Grant Middle School, and Harding High School.
Ownership History
Date
Name
Owned For
Owner Type
Purchase Details
Closed on
Feb 10, 2023
Sold by
George James W
Bought by
George Vanessa L
Current Estimated Value
Purchase Details
Closed on
Jun 20, 2007
Sold by
Bank Of New York Trust Co Na
Bought by
George James W and George Vanessa L
Home Financials for this Owner
Home Financials are based on the most recent Mortgage that was taken out on this home.
Original Mortgage
$28,620
Interest Rate
6.37%
Mortgage Type
New Conventional
Purchase Details
Closed on
Feb 1, 2007
Sold by
French Timothy
Bought by
Jp Morgan Chase Bank
Purchase Details
Closed on
Jul 1, 2003
Bought by
George James W and Surv Vanessa L
Purchase Details
Closed on
Apr 25, 2003
Bought by
George James W and Surv Vanessa L
Purchase Details
Closed on
Aug 16, 2002
Bought by
George James W and Surv Vanessa L
Purchase Details
Closed on
Jan 7, 1993
Bought by
George James W and Surv Vanessa L
Create a Home Valuation Report for This Property
The Home Valuation Report is an in-depth analysis detailing your home's value as well as a comparison with similar homes in the area
Home Values in the Area
Average Home Value in this Area
Purchase History
| Date | Buyer | Sale Price | Title Company |
|---|---|---|---|
| George Vanessa L | -- | -- | |
| George James W | $31,800 | Ryan Cornerstone Title Servi | |
| Jp Morgan Chase Bank | $20,000 | None Available | |
| George James W | $62,000 | -- | |
| George James W | $5,000 | -- | |
| George James W | $5,000 | -- | |
| George James W | $500 | -- |
Source: Public Records
Mortgage History
| Date | Status | Borrower | Loan Amount |
|---|---|---|---|
| Previous Owner | George James W | $28,620 |
Source: Public Records
Tax History Compared to Growth
Tax History
| Year | Tax Paid | Tax Assessment Tax Assessment Total Assessment is a certain percentage of the fair market value that is determined by local assessors to be the total taxable value of land and additions on the property. | Land | Improvement |
|---|---|---|---|---|
| 2024 | $792 | $21,110 | $2,170 | $18,940 |
| 2023 | $792 | $21,110 | $2,170 | $18,940 |
| 2022 | $753 | $21,110 | $2,170 | $18,940 |
| 2021 | $652 | $16,460 | $1,890 | $14,570 |
| 2020 | $654 | $16,460 | $1,890 | $14,570 |
| 2019 | $636 | $16,460 | $1,890 | $14,570 |
| 2018 | $557 | $14,440 | $1,850 | $12,590 |
| 2017 | $565 | $14,440 | $1,850 | $12,590 |
| 2016 | $561 | $14,440 | $1,850 | $12,590 |
| 2015 | $559 | $14,100 | $1,760 | $12,340 |
| 2014 | $561 | $14,100 | $1,760 | $12,340 |
| 2012 | $671 | $16,770 | $2,200 | $14,570 |
Source: Public Records
Map
Nearby Homes
- 523 Thompson St
- 531 Toledo Ave
- 641 Blake Ave
- 520 Toledo Ave
- 355 Lee St
- 485 Avondale Ave
- 468 Avondale Ave
- 134 Waterloo St
- 551 Universal Ave Unit 555
- 343 Commercial St
- 636 Mary St
- 178 Leader St
- 213 Sharp St
- 347 Mary St
- 233 Tully St
- 552 N Prospect St
- 325 Holmes Place
- 395 N Main St
- 736 N Main St
- 593 N State St