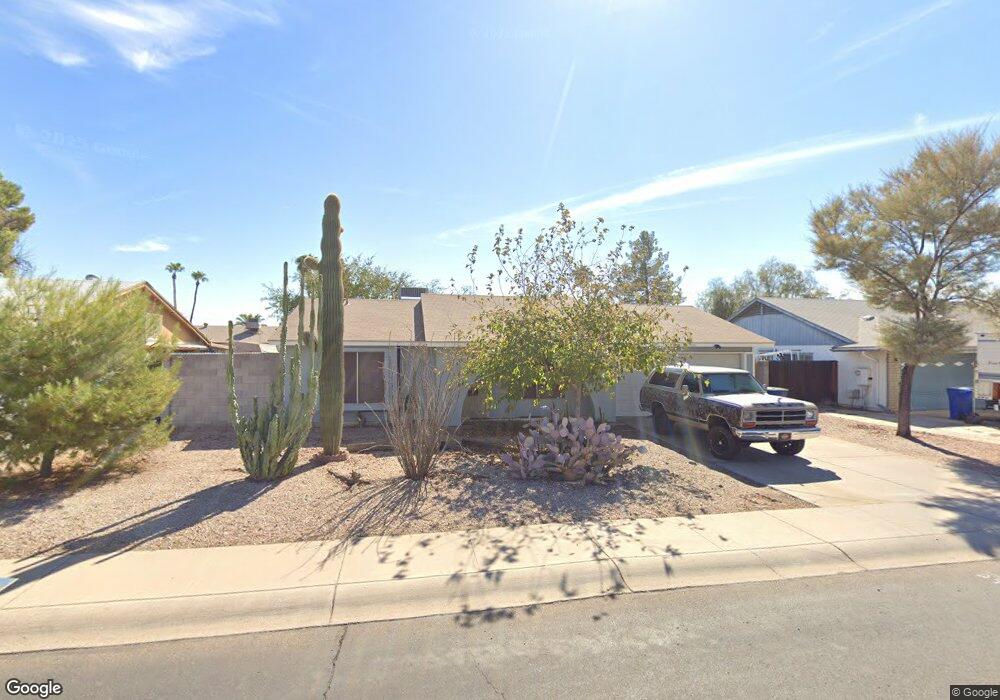
537 W El Alba Way Chandler, AZ 85225
Amberwood NeighborhoodEstimated Value: $312,136 - $351,000
--
Bed
1
Bath
932
Sq Ft
$361/Sq Ft
Est. Value
About This Home
This home is located at 537 W El Alba Way, Chandler, AZ 85225 and is currently estimated at $336,284, approximately $360 per square foot. 537 W El Alba Way is a home located in Maricopa County with nearby schools including Sirrine Elementary School, Franklin at Brimhall Elementary School, and Summit Academy Elementary.
Ownership History
Date
Name
Owned For
Owner Type
Purchase Details
Closed on
Feb 23, 2001
Sold by
Windish Amy M and Wachendorf Brooks J
Bought by
Piispanen Jari P and Piispanen Jari
Current Estimated Value
Home Financials for this Owner
Home Financials are based on the most recent Mortgage that was taken out on this home.
Original Mortgage
$104,565
Outstanding Balance
$37,961
Interest Rate
6.98%
Mortgage Type
FHA
Estimated Equity
$298,323
Purchase Details
Closed on
Jun 12, 1998
Sold by
Windish Amy M
Bought by
Windish Amy M and Wachendorf Brooks J
Purchase Details
Closed on
Mar 12, 1998
Sold by
Legwiec Walter
Bought by
Windish Amy M
Home Financials for this Owner
Home Financials are based on the most recent Mortgage that was taken out on this home.
Original Mortgage
$80,521
Interest Rate
7.11%
Mortgage Type
FHA
Purchase Details
Closed on
Mar 25, 1994
Sold by
Ayers Charles E and Ayers Cynthia
Bought by
Legawiec Walter and Legawiec Mary A
Create a Home Valuation Report for This Property
The Home Valuation Report is an in-depth analysis detailing your home's value as well as a comparison with similar homes in the area
Home Values in the Area
Average Home Value in this Area
Purchase History
| Date | Buyer | Sale Price | Title Company |
|---|---|---|---|
| Piispanen Jari P | $105,500 | Stewart Title & Trust | |
| Windish Amy M | -- | Lawyers Title Of Arizona Inc | |
| Windish Amy M | $80,800 | Grand Canyon Title Agency In | |
| Legawiec Walter | $60,853 | First American Title |
Source: Public Records
Mortgage History
| Date | Status | Borrower | Loan Amount |
|---|---|---|---|
| Open | Piispanen Jari P | $104,565 | |
| Previous Owner | Windish Amy M | $80,521 |
Source: Public Records
Tax History Compared to Growth
Tax History
| Year | Tax Paid | Tax Assessment Tax Assessment Total Assessment is a certain percentage of the fair market value that is determined by local assessors to be the total taxable value of land and additions on the property. | Land | Improvement |
|---|---|---|---|---|
| 2025 | $972 | $11,401 | -- | -- |
| 2024 | $981 | $10,858 | -- | -- |
| 2023 | $981 | $26,130 | $5,220 | $20,910 |
| 2022 | $955 | $19,170 | $3,830 | $15,340 |
| 2021 | $960 | $17,670 | $3,530 | $14,140 |
| 2020 | $949 | $15,670 | $3,130 | $12,540 |
| 2019 | $874 | $14,000 | $2,800 | $11,200 |
| 2018 | $849 | $12,460 | $2,490 | $9,970 |
| 2017 | $816 | $11,320 | $2,260 | $9,060 |
| 2016 | $798 | $10,230 | $2,040 | $8,190 |
| 2015 | $751 | $9,160 | $1,830 | $7,330 |
Source: Public Records
Map
Nearby Homes
- 792 W El Monte Place Unit 8
- 2155 N Grace Blvd Unit 214
- 2155 N Grace Blvd Unit 202
- 2155 N Grace Blvd Unit 213
- 307 W El Prado Rd
- 2066 N Arbor Ln
- 2029 N Sunset Dr
- 812 W Rosal Place
- 305 W Nopal Place
- 286 W Palomino Dr Unit 147
- 286 W Palomino Dr Unit 99
- 286 W Palomino Dr Unit 75
- 286 W Palomino Dr Unit 85
- 286 W Palomino Dr Unit 83
- 1970 N Hartford St Unit 84
- 1970 N Hartford St Unit 88
- 2712 N Evergreen St
- 555 W Warner Rd Unit 127
- 555 W Warner Rd Unit 139
- 555 W Warner Rd Unit 156
- 533 W El Alba Way
- 541 W El Alba Way
- 606 W El Prado Rd Unit 3
- 602 W El Prado Rd Unit 2
- 529 W El Alba Way
- 610 W El Prado Rd
- 534 W El Alba Way
- 538 W El Alba Way
- 530 W El Alba Way
- 600 W El Prado Rd
- 525 W El Alba Way
- 2326 N Cheri Lynn Dr
- 526 W El Alba Way
- 2322 N Cheri Lynn Dr Unit WOW!!
- 2322 N Cheri Lynn Dr
- 2330 N Cheri Lynn Dr
- 2318 N Cheri Lynn Dr Unit 3
- 518 W El Prado Rd
- 2311 N Cheri Lynn Dr
- 522 W El Alba Way