537 W Reed St Unit 3 Moberly, MO 65270
Estimated Value: $138,125 - $208,000
--
Bed
--
Bath
4,140
Sq Ft
$42/Sq Ft
Est. Value
About This Home
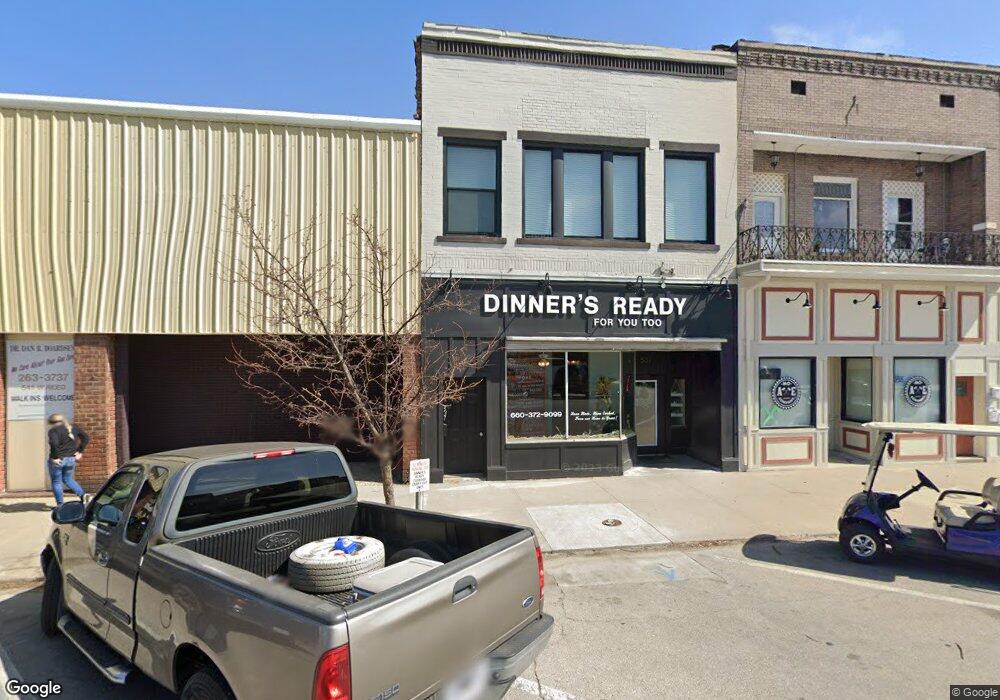
This home is located at 537 W Reed St Unit 3, Moberly, MO 65270 and is currently estimated at $173,281, approximately $41 per square foot. 537 W Reed St Unit 3 is a home located in Randolph County with nearby schools including Moberly Senior High School, St. Pius X. Catholic School, and Maranatha Seventh-day Adventist School.
Ownership History
Date
Name
Owned For
Owner Type
Purchase Details
Closed on
Aug 15, 2024
Sold by
Mamre Farm Llc
Bought by
Redhead Commercial Properties Llc
Current Estimated Value
Home Financials for this Owner
Home Financials are based on the most recent Mortgage that was taken out on this home.
Original Mortgage
$185,140
Outstanding Balance
$182,017
Interest Rate
6.95%
Mortgage Type
Credit Line Revolving
Estimated Equity
-$8,736
Purchase Details
Closed on
Feb 20, 2019
Sold by
Guo Yidi and Chen Irene A
Bought by
Mamre Farm Llc
Create a Home Valuation Report for This Property
The Home Valuation Report is an in-depth analysis detailing your home's value as well as a comparison with similar homes in the area
Home Values in the Area
Average Home Value in this Area
Purchase History
| Date | Buyer | Sale Price | Title Company |
|---|---|---|---|
| Redhead Commercial Properties Llc | -- | None Listed On Document | |
| Mamre Farm Llc | -- | -- |
Source: Public Records
Mortgage History
| Date | Status | Borrower | Loan Amount |
|---|---|---|---|
| Open | Redhead Commercial Properties Llc | $185,140 |
Source: Public Records
Tax History Compared to Growth
Tax History
| Year | Tax Paid | Tax Assessment Tax Assessment Total Assessment is a certain percentage of the fair market value that is determined by local assessors to be the total taxable value of land and additions on the property. | Land | Improvement |
|---|---|---|---|---|
| 2025 | $1,048 | $14,400 | $1,930 | $12,470 |
| 2024 | $1,048 | $14,400 | $1,930 | $12,470 |
| 2023 | $1,048 | $14,400 | $1,930 | $12,470 |
| 2022 | $1,048 | $14,400 | $1,930 | $12,470 |
| 2021 | $1,048 | $14,400 | $1,930 | $12,470 |
| 2020 | $1,048 | $14,400 | $1,930 | $12,470 |
| 2019 | $1,048 | $14,400 | $1,930 | $12,470 |
| 2018 | $1,047 | $14,400 | $1,930 | $12,470 |
| 2017 | $1,046 | $14,410 | $0 | $0 |
| 2016 | $1,008 | $13,950 | $0 | $0 |
| 2014 | -- | $15,470 | $0 | $0 |
| 2013 | -- | $15,470 | $0 | $0 |
| 2012 | -- | $15,430 | $0 | $0 |
Source: Public Records
Map
Nearby Homes
- 710 W Rollins St
- 216 S 5th St
- 800 Franklin St
- 808 W Reed St
- 816 W Reed St
- 309 S 4th St
- 620 Burkholder St
- 632 W Logan St
- 419 S 4th St
- 407 Epperson St
- 101 N Ault St
- 809 Myra St
- 236 Bedford St
- 812 N Moulton St
- LOT 2 County Rd
- 1377 Conestoga Trail
- 517 S Clark St
- 1029 Concannon St
- 1123 Concannon St
- 817 Gilman St