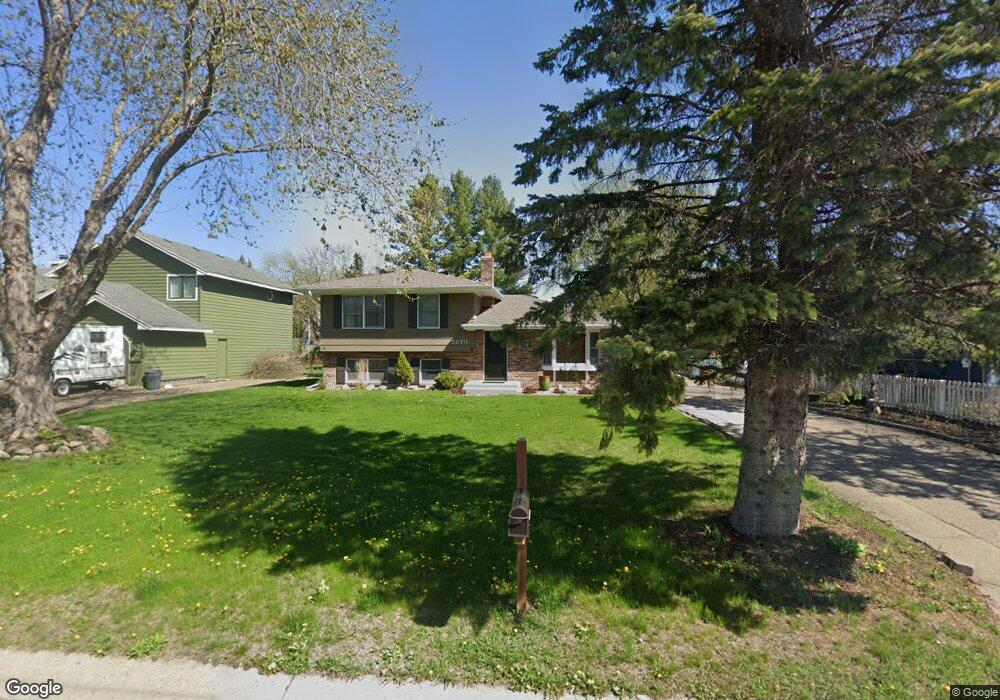
5370 Clayton Dr Maple Plain, MN 55359
Estimated Value: $379,553 - $425,000
3
Beds
2
Baths
1,832
Sq Ft
$220/Sq Ft
Est. Value
About This Home
This home is located at 5370 Clayton Dr, Maple Plain, MN 55359 and is currently estimated at $403,138, approximately $220 per square foot. 5370 Clayton Dr is a home located in Hennepin County with nearby schools including Schumann Elementary School, Orono Intermediate Elementary School, and Orono Middle School.
Ownership History
Date
Name
Owned For
Owner Type
Purchase Details
Closed on
Nov 8, 2021
Sold by
Johnson Logan C and Estate Of Beth B Johnson
Bought by
Brey John D and Brey Sheila K
Current Estimated Value
Home Financials for this Owner
Home Financials are based on the most recent Mortgage that was taken out on this home.
Original Mortgage
$244,300
Outstanding Balance
$224,168
Interest Rate
3.09%
Mortgage Type
New Conventional
Estimated Equity
$178,970
Purchase Details
Closed on
Jan 30, 2017
Sold by
Denneson Troy A and Denneson Heidi J
Bought by
Johnson Beth B
Home Financials for this Owner
Home Financials are based on the most recent Mortgage that was taken out on this home.
Original Mortgage
$162,150
Interest Rate
4.2%
Mortgage Type
New Conventional
Purchase Details
Closed on
Jul 18, 2016
Sold by
Denneson Troy A and Denneson Heidi J
Bought by
Johnson Beth B
Home Financials for this Owner
Home Financials are based on the most recent Mortgage that was taken out on this home.
Original Mortgage
$176,250
Interest Rate
3.5%
Mortgage Type
Seller Take Back
Purchase Details
Closed on
Jun 30, 1997
Sold by
Sholund Elvin M and Sholund Doris N
Bought by
Denneson Troy A
Create a Home Valuation Report for This Property
The Home Valuation Report is an in-depth analysis detailing your home's value as well as a comparison with similar homes in the area
Home Values in the Area
Average Home Value in this Area
Purchase History
| Date | Buyer | Sale Price | Title Company |
|---|---|---|---|
| Brey John D | $349,000 | Executive Title | |
| Johnson Beth B | $182,285 | None Available | |
| Johnson Beth B | $235,000 | Burnet Title | |
| Denneson Troy A | $130,000 | -- |
Source: Public Records
Mortgage History
| Date | Status | Borrower | Loan Amount |
|---|---|---|---|
| Open | Brey John D | $244,300 | |
| Previous Owner | Johnson Beth B | $162,150 | |
| Previous Owner | Johnson Beth B | $176,250 |
Source: Public Records
Tax History
| Year | Tax Paid | Tax Assessment Tax Assessment Total Assessment is a certain percentage of the fair market value that is determined by local assessors to be the total taxable value of land and additions on the property. | Land | Improvement |
|---|---|---|---|---|
| 2024 | $4,436 | $343,300 | $68,000 | $275,300 |
| 2023 | $4,164 | $344,500 | $73,000 | $271,500 |
| 2022 | $4,095 | $330,000 | $71,000 | $259,000 |
| 2021 | $3,662 | $293,000 | $71,000 | $222,000 |
| 2020 | $3,756 | $264,000 | $51,000 | $213,000 |
| 2019 | $3,655 | $257,000 | $50,000 | $207,000 |
| 2018 | $3,674 | $242,000 | $44,000 | $198,000 |
| 2017 | $3,625 | $222,000 | $45,000 | $177,000 |
| 2016 | $3,541 | $217,000 | $55,000 | $162,000 |
| 2015 | $3,320 | $202,000 | $48,000 | $154,000 |
| 2014 | -- | $208,000 | $61,000 | $147,000 |
Source: Public Records
Map
Nearby Homes
- 5340 Main St E
- 1635 Delano Ave
- 5245 Clayton Dr
- 5508 Joyce St
- 5183 Independence St
- 5540 Timber Trail
- 1351 County Road 83
- 4819 Baker Reserve Ln
- 1487 Meadow Ln
- 4842 Baker Reserve Ln
- 4801 Baker Reserve Ln
- 2017 Bridgevine Ct
- 2045 Bridgevine Ct
- 2101 Bridgevine Ct
- 2084 Bridgevine Ct
- 2073 Bridgevine Ct
- 4894 Bridgevine Way
- 4946 Bridgevine Way
- 2224 Bridgevine Ct
- 4972 Bridgevine Way
- 5380 Clayton Dr
- 5358 Clayton Dr
- 5396 Clayton Dr
- 5369 Bryant St
- 5379 Bryant St
- 5359 Bryant St
- 5369 Clayton Dr
- 5328 Clayton Dr
- 5357 Clayton Dr
- 5395 Bryant St
- 5410 Clayton Dr
- 5385 Clayton Dr
- 5345 Bryant St
- 5401 Clayton Dr
- 5415 Bryant St
- 5329 Clayton Dr
- 5320 Clayton Dr
- 5420 Clayton Dr
- 5350 Joyce St
- 5329 Bryant St
Your Personal Tour Guide
Ask me questions while you tour the home.