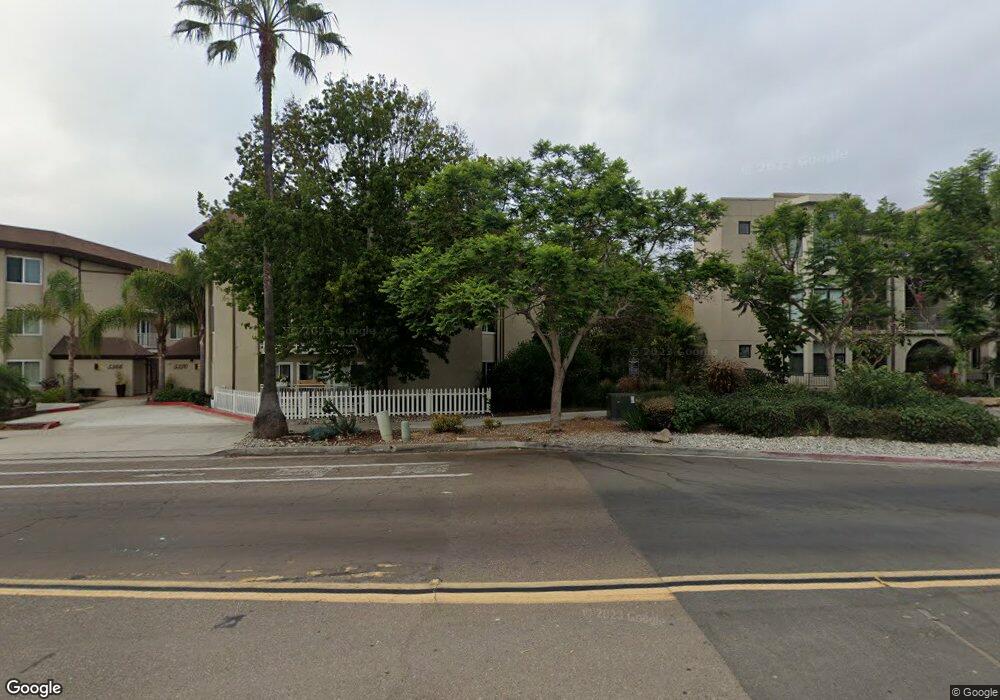
5370 La Jolla Blvd Unit 205B La Jolla, CA 92037
Bird Rock NeighborhoodEstimated Value: $1,228,000 - $1,545,000
2
Beds
2
Baths
1,466
Sq Ft
$948/Sq Ft
Est. Value
About This Home
This home is located at 5370 La Jolla Blvd Unit 205B, La Jolla, CA 92037 and is currently estimated at $1,389,970, approximately $948 per square foot. 5370 La Jolla Blvd Unit 205B is a home located in San Diego County with nearby schools including Bird Rock Elementary School, Muirlands Middle School, and La Jolla High School.
Ownership History
Date
Name
Owned For
Owner Type
Purchase Details
Closed on
Jan 20, 2022
Sold by
Shakila Patel
Bought by
Shakila Patel Living Trust
Current Estimated Value
Purchase Details
Closed on
Dec 22, 2015
Sold by
Osborn Kent Jordan
Bought by
Patel Shakila and Patel Abdul Aleem
Home Financials for this Owner
Home Financials are based on the most recent Mortgage that was taken out on this home.
Original Mortgage
$450,000
Interest Rate
3.92%
Mortgage Type
New Conventional
Purchase Details
Closed on
Jun 2, 2013
Sold by
Scott Janice K
Bought by
The Janice Kay Scott Living Trust
Purchase Details
Closed on
Dec 1, 1994
Sold by
Eisenstein Rae Gene
Bought by
Scott Janice K
Home Financials for this Owner
Home Financials are based on the most recent Mortgage that was taken out on this home.
Original Mortgage
$133,000
Interest Rate
6.23%
Mortgage Type
Purchase Money Mortgage
Create a Home Valuation Report for This Property
The Home Valuation Report is an in-depth analysis detailing your home's value as well as a comparison with similar homes in the area
Home Values in the Area
Average Home Value in this Area
Purchase History
| Date | Buyer | Sale Price | Title Company |
|---|---|---|---|
| Shakila Patel Living Trust | -- | Albence & Associates | |
| Patel Shakila | $575,000 | Ticor Title San Diego | |
| The Janice Kay Scott Living Trust | -- | None Available | |
| Scott Janice K | $140,000 | Fidelity National Title Ins |
Source: Public Records
Mortgage History
| Date | Status | Borrower | Loan Amount |
|---|---|---|---|
| Previous Owner | Patel Shakila | $450,000 | |
| Previous Owner | Scott Janice K | $133,000 |
Source: Public Records
Tax History Compared to Growth
Tax History
| Year | Tax Paid | Tax Assessment Tax Assessment Total Assessment is a certain percentage of the fair market value that is determined by local assessors to be the total taxable value of land and additions on the property. | Land | Improvement |
|---|---|---|---|---|
| 2025 | $8,211 | $680,674 | $263,412 | $417,262 |
| 2024 | $8,211 | $667,329 | $258,248 | $409,081 |
| 2023 | $8,116 | $654,245 | $253,185 | $401,060 |
| 2022 | $7,817 | $628,842 | $243,354 | $385,488 |
| 2021 | $7,756 | $628,842 | $243,354 | $385,488 |
| 2020 | $7,662 | $622,395 | $240,859 | $381,536 |
| 2019 | $7,525 | $610,192 | $236,137 | $374,055 |
| 2018 | $7,041 | $598,228 | $231,507 | $366,721 |
| 2017 | $80 | $586,499 | $226,968 | $359,531 |
| 2016 | $2,419 | $198,626 | $76,866 | $121,760 |
| 2015 | $2,307 | $195,644 | $75,712 | $119,932 |
| 2014 | $2,271 | $191,812 | $74,229 | $117,583 |
Source: Public Records
Map
Nearby Homes
- 5357 La Jolla Blvd Unit 29
- 5341 Linda Way
- 315 Colima Ct
- 5460 La Jolla Blvd Unit G202
- 5470 La Jolla Blvd Unit H102
- 5366 Calumet Ave
- 5490 La Jolla Blvd Unit K205
- 623 Colima St
- 5527 Calumet Ave
- 608 Forward St
- 5641 La Jolla Hermosa Ave
- 5641 Chelsea Ave
- 819 Van Nuys St
- 751-63 Turquoise St Unit 27-30
- 727 Sapphire St Unit 301
- 5664 Abalone Place
- 5416 Candlelight Dr
- 5762 Bellevue Ave
- 5710 Dolphin Place
- 5716 Dolphin Place
- 5370 La Jolla Blvd Unit B104
- 5370 La Jolla Blvd Unit B201
- 5370 La Jolla Blvd
- 5370 La Jolla Blvd Unit 204B
- 5370 La Jolla Blvd Unit 205
- 5370 La Jolla Blvd Unit 203
- 5370 La Jolla Blvd Unit 203B
- 5370 La Jolla Blvd Unit 304B
- 5370 La Jolla Blvd Unit 301B
- 5370 La Jolla Blvd Unit 202B
- 5370 La Jolla Blvd Unit 105B
- 5370 La Jolla Blvd Unit 104B
- 5370 La Jolla Blvd Unit 2
- 5370 La Jolla Blvd Unit 201B
- 5370 La Jolla Blvd Unit 303B
- 5370 La Jolla Blvd Unit 302
- 5370 La Jolla Blvd Unit 103B
- 5370 La Jolla Blvd Unit 102B
- 5370 La Jolla Blvd Unit 101B
- 5366 La Jolla Blvd Unit 204C