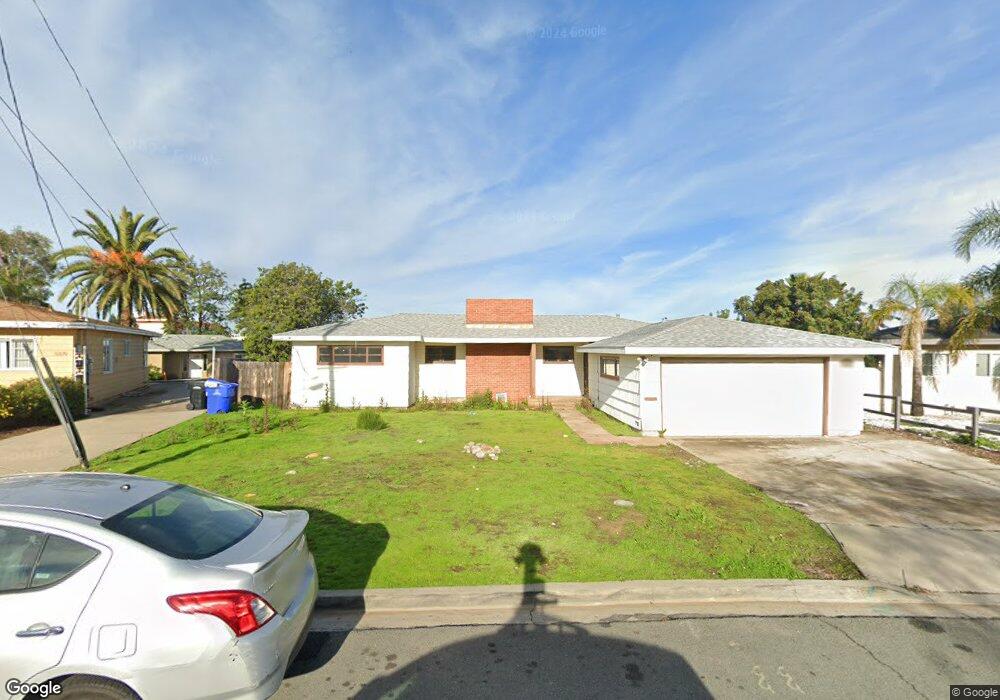
5372 W Falls View Dr San Diego, CA 92115
College East NeighborhoodEstimated Value: $971,000 - $1,234,000
2
Beds
2
Baths
1,345
Sq Ft
$824/Sq Ft
Est. Value
About This Home
This home is located at 5372 W Falls View Dr, San Diego, CA 92115 and is currently estimated at $1,108,391, approximately $824 per square foot. 5372 W Falls View Dr is a home located in San Diego County with nearby schools including Hardy Elementary School, Clay Elementary School, and Lewis Middle School.
Ownership History
Date
Name
Owned For
Owner Type
Purchase Details
Closed on
Jan 1, 2022
Sold by
Qu Ziqin
Bought by
Qu Ziqin
Current Estimated Value
Home Financials for this Owner
Home Financials are based on the most recent Mortgage that was taken out on this home.
Original Mortgage
$562,500
Outstanding Balance
$518,482
Interest Rate
3.12%
Mortgage Type
New Conventional
Estimated Equity
$589,909
Purchase Details
Closed on
Jun 15, 2001
Sold by
Knepper Thomas
Bought by
Metropolitan Transit Development Board
Purchase Details
Closed on
Sep 15, 1994
Sold by
Lieberenz Carl H and Lieberenz Marion R
Bought by
Knepper Thomas L
Home Financials for this Owner
Home Financials are based on the most recent Mortgage that was taken out on this home.
Original Mortgage
$124,000
Interest Rate
8.7%
Create a Home Valuation Report for This Property
The Home Valuation Report is an in-depth analysis detailing your home's value as well as a comparison with similar homes in the area
Home Values in the Area
Average Home Value in this Area
Purchase History
| Date | Buyer | Sale Price | Title Company |
|---|---|---|---|
| Qu Ziqin | -- | Wfg Title Co Of Ca San Diego | |
| Metropolitan Transit Development Board | -- | First American Title | |
| Knepper Thomas L | $155,000 | First American Title Co |
Source: Public Records
Mortgage History
| Date | Status | Borrower | Loan Amount |
|---|---|---|---|
| Open | Qu Ziqin | $562,500 | |
| Previous Owner | Knepper Thomas L | $124,000 |
Source: Public Records
Tax History Compared to Growth
Tax History
| Year | Tax Paid | Tax Assessment Tax Assessment Total Assessment is a certain percentage of the fair market value that is determined by local assessors to be the total taxable value of land and additions on the property. | Land | Improvement |
|---|---|---|---|---|
| 2025 | $3,168 | $260,165 | $88,319 | $171,846 |
| 2024 | $3,168 | $255,065 | $86,588 | $168,477 |
| 2023 | $3,097 | $250,065 | $84,891 | $165,174 |
| 2022 | $3,015 | $245,163 | $83,227 | $161,936 |
| 2021 | $2,995 | $240,357 | $81,596 | $158,761 |
| 2020 | $2,872 | $237,894 | $80,760 | $157,134 |
| 2019 | $2,820 | $233,230 | $79,177 | $154,053 |
| 2018 | $2,636 | $228,658 | $77,625 | $151,033 |
| 2017 | $2,572 | $224,175 | $76,103 | $148,072 |
| 2016 | $2,528 | $219,780 | $74,611 | $145,169 |
| 2015 | $2,490 | $216,480 | $73,491 | $142,989 |
| 2014 | $2,450 | $212,241 | $72,052 | $140,189 |
Source: Public Records
Map
Nearby Homes
- 6510 Airoso Ave
- 6457 Julie St
- 6496 Cleo St
- 6411 Gary Ct
- 5701 Madra Ave
- 5157 Catoctin Dr
- 6486 Montezuma Rd
- 5092 Catoctin Dr
- 6183 Rockhurst Dr
- 6464 Del Cerro Blvd
- 4917 Rockford Dr
- 6196 Rockhurst Dr
- 6517 Hillgrove Dr
- 5540 Lindo Paseo Unit 19
- 6342 Lambda Dr
- 6651 Reservoir Ln
- 5996 College Ave
- 4926 Cresita Dr
- 6570 Hillgrove Dr
- 6615 Reservoir Ct
- 5368 W Falls View Dr
- 5376 W Falls View Dr
- W W Falls View Dr
- 5379 E Falls View Dr
- 5373 W Falls View Dr
- 5376 E Falls View Dr
- 5364 W Falls View Dr
- 5370 E Falls View Dr
- 5363 W Falls View Dr
- 5360 W Falls View Dr
- 5375 E Falls View Dr
- 5357 W Falls View Dr
- 5358 E Falls View Dr
- 5356 W Falls View Dr
- 5371 E Falls View Dr
- 5354 E Falls View Dr
- 5353 W Falls View Dr
- 5352 W Falls View Dr
- 5365 E Falls View Dr
- 5350 E Falls View Dr