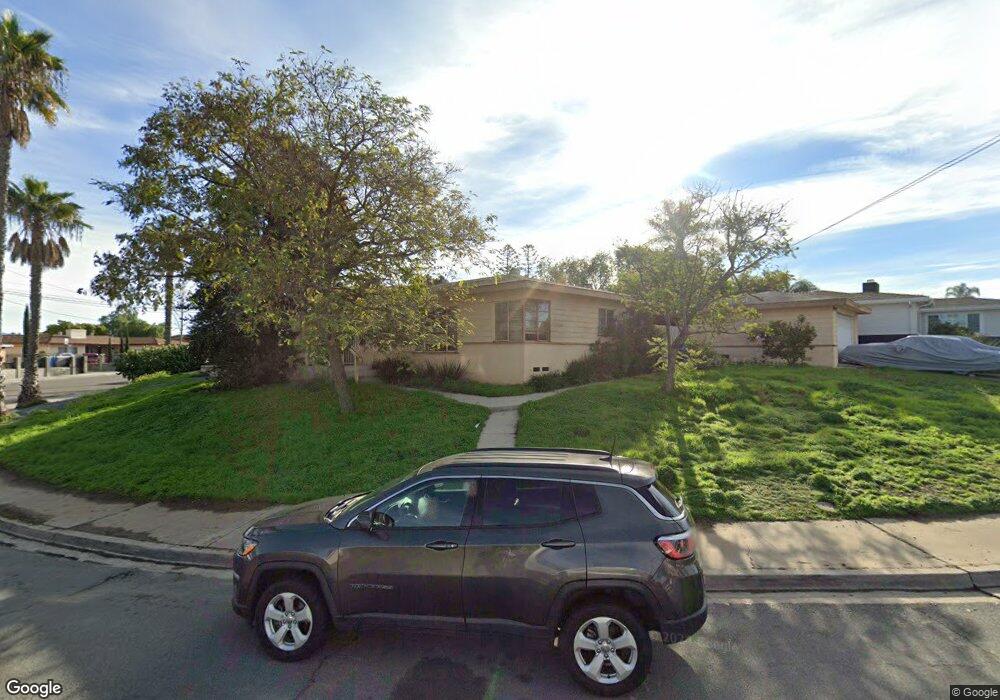
5373 W Falls View Dr San Diego, CA 92115
College East NeighborhoodEstimated Value: $984,930 - $1,229,000
3
Beds
2
Baths
1,367
Sq Ft
$852/Sq Ft
Est. Value
About This Home
This home is located at 5373 W Falls View Dr, San Diego, CA 92115 and is currently estimated at $1,164,483, approximately $851 per square foot. 5373 W Falls View Dr is a home located in San Diego County with nearby schools including Hardy Elementary School, Clay Elementary School, and Lewis Middle School.
Ownership History
Date
Name
Owned For
Owner Type
Purchase Details
Closed on
Feb 14, 2013
Sold by
Koch Fredric P
Bought by
Koch Fredric P
Current Estimated Value
Create a Home Valuation Report for This Property
The Home Valuation Report is an in-depth analysis detailing your home's value as well as a comparison with similar homes in the area
Home Values in the Area
Average Home Value in this Area
Purchase History
| Date | Buyer | Sale Price | Title Company |
|---|---|---|---|
| Koch Fredric P | -- | None Available | |
| Koch Fredric P | -- | None Available |
Source: Public Records
Tax History Compared to Growth
Tax History
| Year | Tax Paid | Tax Assessment Tax Assessment Total Assessment is a certain percentage of the fair market value that is determined by local assessors to be the total taxable value of land and additions on the property. | Land | Improvement |
|---|---|---|---|---|
| 2025 | $981 | $85,654 | $28,852 | $56,802 |
| 2024 | $981 | $83,976 | $28,287 | $55,689 |
| 2023 | $956 | $82,331 | $27,733 | $54,598 |
| 2022 | $930 | $80,718 | $27,190 | $53,528 |
| 2021 | $922 | $79,136 | $26,657 | $52,479 |
| 2020 | $910 | $78,325 | $26,384 | $51,941 |
| 2019 | $893 | $76,790 | $25,867 | $50,923 |
| 2018 | $835 | $75,285 | $25,360 | $49,925 |
| 2017 | $80 | $73,810 | $24,863 | $48,947 |
| 2016 | $797 | $72,364 | $24,376 | $47,988 |
| 2015 | $785 | $71,278 | $24,010 | $47,268 |
| 2014 | $772 | $69,883 | $23,540 | $46,343 |
Source: Public Records
Map
Nearby Homes
- 6510 Airoso Ave
- 6457 Julie St
- 6496 Cleo St
- 6411 Gary Ct
- 5157 Catoctin Dr
- 6486 Montezuma Rd
- 5092 Catoctin Dr
- 4917 Rockford Dr
- 5701 Madra Ave
- 5540 Lindo Paseo Unit 19
- 6464 Del Cerro Blvd
- 6183 Rockhurst Dr
- 4926 Cresita Dr
- 6651 Reservoir Ln
- 6517 Hillgrove Dr
- 6196 Rockhurst Dr
- 6342 Lambda Dr
- 6615 Reservoir Ct
- 4860 Rolando Ct Unit 52
- 4860 Rolando Ct Unit 25
- 5363 W Falls View Dr
- 5370 E Falls View Dr
- 5376 E Falls View Dr
- 5358 E Falls View Dr
- 5357 W Falls View Dr
- 5372 W Falls View Dr
- 5368 W Falls View Dr
- 5379 E Falls View Dr
- 5354 E Falls View Dr
- 5353 W Falls View Dr
- 5375 E Falls View Dr
- 5364 W Falls View Dr
- 5376 W Falls View Dr
- W W Falls View Dr
- 5360 W Falls View Dr
- 5350 E Falls View Dr
- 5371 E Falls View Dr
- 5349 W Falls View Dr
- 5356 W Falls View Dr
- 5346 E Falls View Dr