5376 Skycrest Dr El Dorado, CA 95623
Estimated Value: $372,000 - $514,000
3
Beds
2
Baths
1,092
Sq Ft
$411/Sq Ft
Est. Value
About This Home
This home is located at 5376 Skycrest Dr, El Dorado, CA 95623 and is currently estimated at $448,806, approximately $410 per square foot. 5376 Skycrest Dr is a home located in El Dorado County with nearby schools including Herbert C. Green Middle School, Indian Creek Elementary School, and Union Mine High School.
Ownership History
Date
Name
Owned For
Owner Type
Purchase Details
Closed on
Feb 22, 1999
Sold by
Mood Raymond and Bisgaard Kim B
Bought by
Whitted Michael
Current Estimated Value
Home Financials for this Owner
Home Financials are based on the most recent Mortgage that was taken out on this home.
Original Mortgage
$80,500
Outstanding Balance
$19,119
Interest Rate
6.78%
Estimated Equity
$429,687
Purchase Details
Closed on
Aug 11, 1998
Sold by
Linger Eugene F and Linger Rhonda L
Bought by
Loftin Jim P and Loftin Mary A
Purchase Details
Closed on
Apr 2, 1997
Sold by
Sheridan Elizabeth L and Sheridan Jacqueline
Bought by
Mood Raymond and Bisgaard Kim B
Home Financials for this Owner
Home Financials are based on the most recent Mortgage that was taken out on this home.
Original Mortgage
$107,129
Interest Rate
7.56%
Mortgage Type
FHA
Create a Home Valuation Report for This Property
The Home Valuation Report is an in-depth analysis detailing your home's value as well as a comparison with similar homes in the area
Home Values in the Area
Average Home Value in this Area
Purchase History
| Date | Buyer | Sale Price | Title Company |
|---|---|---|---|
| Whitted Michael | $125,500 | Inter County Title Co | |
| Loftin Jim P | -- | -- | |
| Mood Raymond | $108,000 | Placer Title Company |
Source: Public Records
Mortgage History
| Date | Status | Borrower | Loan Amount |
|---|---|---|---|
| Open | Whitted Michael | $80,500 | |
| Previous Owner | Mood Raymond | $107,129 |
Source: Public Records
Tax History Compared to Growth
Tax History
| Year | Tax Paid | Tax Assessment Tax Assessment Total Assessment is a certain percentage of the fair market value that is determined by local assessors to be the total taxable value of land and additions on the property. | Land | Improvement |
|---|---|---|---|---|
| 2025 | $1,881 | $186,589 | $78,371 | $108,218 |
| 2024 | $1,881 | $182,932 | $76,835 | $106,097 |
| 2023 | $1,842 | $179,346 | $75,329 | $104,017 |
| 2022 | $1,814 | $175,830 | $73,852 | $101,978 |
| 2021 | $1,803 | $172,383 | $72,404 | $99,979 |
| 2020 | $1,763 | $170,616 | $71,662 | $98,954 |
| 2019 | $1,734 | $167,271 | $70,257 | $97,014 |
| 2018 | $1,685 | $163,992 | $68,880 | $95,112 |
| 2017 | $1,654 | $160,778 | $67,530 | $93,248 |
| 2016 | $1,634 | $157,626 | $66,206 | $91,420 |
| 2015 | $1,549 | $155,260 | $65,212 | $90,048 |
| 2014 | $1,549 | $152,221 | $63,936 | $88,285 |
Source: Public Records
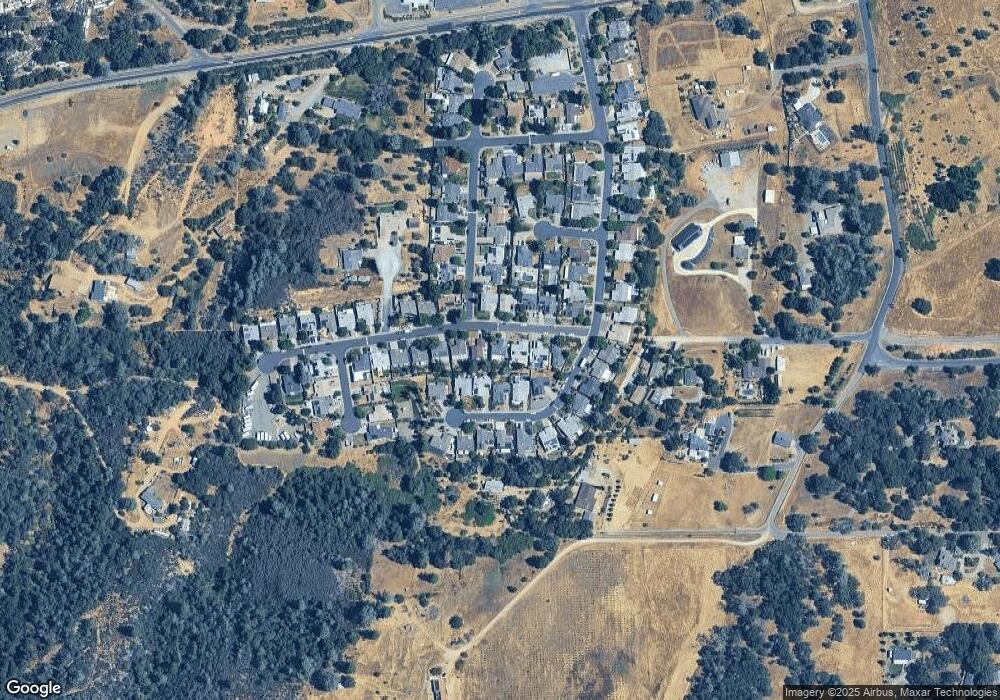
Map
Nearby Homes
- 5379 Skycrest Dr
- 4895 Summit View Ct
- 5520 Mother Lode Dr
- 2 Shinn Ranch Rd
- 3 Shinn Ranch Rd
- 4700 Old French Town Rd
- 4700 Old French Town Rd Unit 85
- 4700 Old French Town Rd Unit 94
- 4700 Old French Town Rd Unit 64
- 4700 Old French Town Rd Unit 23
- 7110 Shinn Ranch Rd
- 4460 Fawn St
- 0 Cutty Sark Ln
- 4919 Mother Lode Dr
- 4244 Boles Rd
- 4211 China Hill Ct
- 5353 Silver Lode Dr
- 0 NE El Dorado Rd Unit 225074644
- 4420 El Dorado Rd
- 4121 Shingle Springs Dr
- 5380 Skycrest Dr
- 5372 Skycrest Dr
- 5386 Skycrest Dr
- 5366 Skycrest Dr
- 4918 4918 Summit View Ct
- 4922 Summit View Ct
- 4914 Summit View Ct
- 5373 Skycrest Dr
- 4928 Summit View Ct
- 5383 Skycrest Dr Unit 1
- 4906 Summit View Ct
- 5360 Skycrest Dr
- 5392 Skycrest Dr
- 5389 Skycrest Dr
- 5365 Skycrest Dr
- 4932 Summit View Ct
- 4867 Hillbrook Dr
- 5356 Skycrest Dr
- 4880 Summit View Dr
- 5361 Skycrest Dr