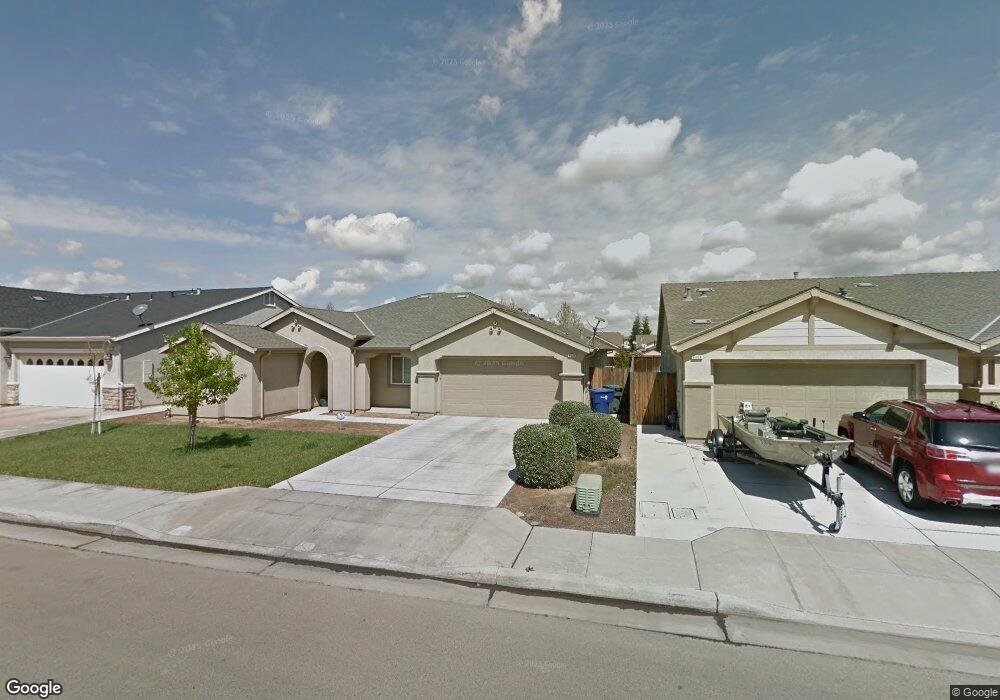
5376 W Peralta Way Fresno, CA 93722
West Fresno NeighborhoodEstimated Value: $426,367 - $447,000
4
Beds
2
Baths
1,964
Sq Ft
$221/Sq Ft
Est. Value
About This Home
This home is located at 5376 W Peralta Way, Fresno, CA 93722 and is currently estimated at $434,342, approximately $221 per square foot. 5376 W Peralta Way is a home located in Fresno County with nearby schools including James K. Polk Elementary, El Capitan Middle School, and Central East High School.
Ownership History
Date
Name
Owned For
Owner Type
Purchase Details
Closed on
Jun 29, 2018
Sold by
Gastelo Ruben and Gastelo Elizabeth
Bought by
Hernandez Victor M and Hernandez Daisy
Current Estimated Value
Home Financials for this Owner
Home Financials are based on the most recent Mortgage that was taken out on this home.
Original Mortgage
$266,750
Outstanding Balance
$231,690
Interest Rate
4.6%
Mortgage Type
New Conventional
Estimated Equity
$202,652
Purchase Details
Closed on
Feb 3, 2009
Sold by
Kb Home South Bay Inc
Bought by
Gastelo Ruben and Gastelo Elizabeth
Home Financials for this Owner
Home Financials are based on the most recent Mortgage that was taken out on this home.
Original Mortgage
$180,675
Interest Rate
5.04%
Mortgage Type
FHA
Create a Home Valuation Report for This Property
The Home Valuation Report is an in-depth analysis detailing your home's value as well as a comparison with similar homes in the area
Home Values in the Area
Average Home Value in this Area
Purchase History
| Date | Buyer | Sale Price | Title Company |
|---|---|---|---|
| Hernandez Victor M | $275,000 | Chicago Title Company | |
| Gastelo Ruben | $183,500 | First American Title Company |
Source: Public Records
Mortgage History
| Date | Status | Borrower | Loan Amount |
|---|---|---|---|
| Open | Hernandez Victor M | $266,750 | |
| Previous Owner | Gastelo Ruben | $180,675 |
Source: Public Records
Tax History Compared to Growth
Tax History
| Year | Tax Paid | Tax Assessment Tax Assessment Total Assessment is a certain percentage of the fair market value that is determined by local assessors to be the total taxable value of land and additions on the property. | Land | Improvement |
|---|---|---|---|---|
| 2025 | $4,170 | $306,763 | $92,028 | $214,735 |
| 2023 | $4,006 | $294,853 | $88,455 | $206,398 |
| 2022 | $3,720 | $289,072 | $86,721 | $202,351 |
| 2021 | $3,740 | $283,405 | $85,021 | $198,384 |
| 2020 | $3,652 | $280,500 | $84,150 | $196,350 |
| 2019 | $3,568 | $275,000 | $82,500 | $192,500 |
| 2018 | $2,575 | $207,108 | $56,585 | $150,523 |
| 2017 | $2,556 | $203,048 | $55,476 | $147,572 |
| 2016 | $2,397 | $199,068 | $54,389 | $144,679 |
| 2015 | $2,119 | $176,100 | $52,800 | $123,300 |
| 2014 | $2,024 | $165,000 | $49,500 | $115,500 |
Source: Public Records
Map
Nearby Homes
- 5585 W Cotton Ave
- 5565 W Lamona Ave
- 1613 N Ellendale Ave
- 2123 N Lodi Ave
- 5109 W Clinton Ave
- 1887 N Belvedere Ave
- 17 Acre Lot McKinley & Hayes
- 2210 N Antioch Ave
- 1656 N Cecelia Ave
- 1741 N Blythe Ave
- 2393 N Blythe Ave
- 1714 N Blythe Ave
- 2437 N Tracy Ave
- 4569 W Michigan Ave
- 4765 W Shields Ave
- 4360 W Vassar Ave
- 5866 W Shields Ave
- 4694 W Shields Ave
- 2260 N Hanover Ave
- 2387 N Hanover Ave
- 5394 W Peralta Way
- 5368 W Peralta Way
- 5379 W Dori Ave
- 5408 W Peralta Way
- 5391 W Dori Ave
- 5367 W Dori Ave
- 5409 W Dori Ave
- 5416 W Peralta Way
- 5377 W Peralta Way
- 5365 W Peralta Way
- 5393 W Peralta Way
- 2030 N Delbert Ave
- 2044 N Delbert Ave
- 5417 W Dori Ave
- 2018 N Delbert Ave
- 5407 W Peralta Way
- 2052 N Delbert Ave
- 5424 W Peralta Way
- 2010 N Delbert Ave
- 2066 N Delbert Ave