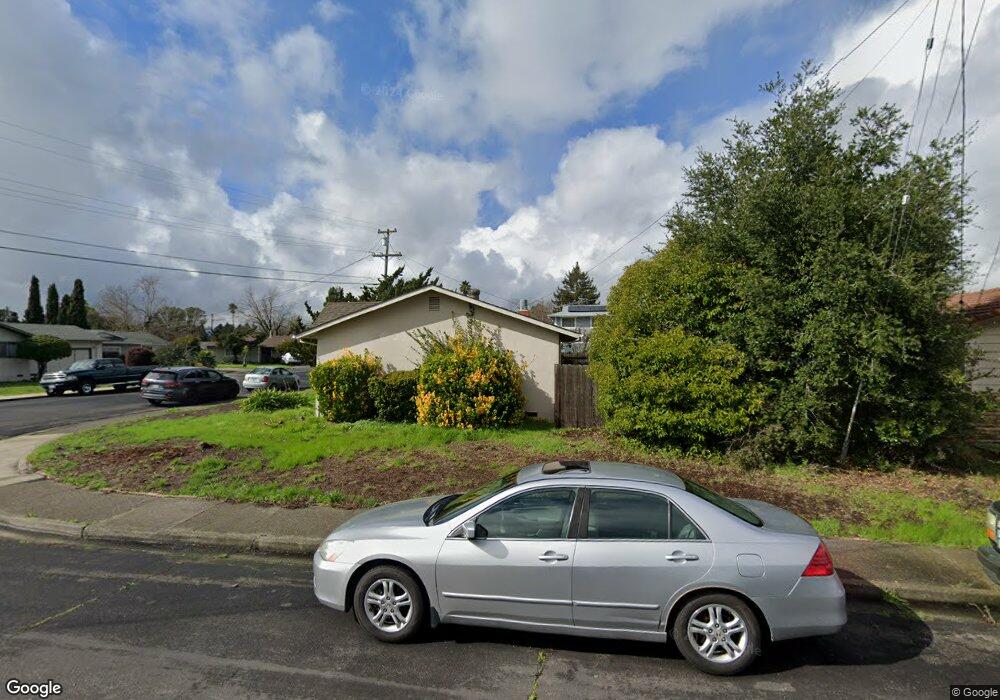
538 Anson Ave Rohnert Park, CA 94928
Estimated Value: $652,507 - $718,000
3
Beds
2
Baths
1,200
Sq Ft
$563/Sq Ft
Est. Value
About This Home
This home is located at 538 Anson Ave, Rohnert Park, CA 94928 and is currently estimated at $675,377, approximately $562 per square foot. 538 Anson Ave is a home located in Sonoma County with nearby schools including Rancho Cotate High School, Cross & Crown Lutheran School, and Bridghaven.
Ownership History
Date
Name
Owned For
Owner Type
Purchase Details
Closed on
Nov 5, 2024
Sold by
Jackson Allen L and Jackson Debra L
Bought by
1999 Allen L Jackson And Debra L Jackson Revo and Jackson
Current Estimated Value
Purchase Details
Closed on
May 21, 2007
Sold by
Jackson Helen M and The Kenneth & Helen Jackson Re
Bought by
Jackson Helen M and The Kenneth R Jackson Bypass T
Purchase Details
Closed on
Jul 19, 2002
Sold by
Maas Maas Carleen J Carleen J and Maas Howard H
Bought by
Jackson Kenneth R and Jackson Helen M
Purchase Details
Closed on
Oct 26, 2000
Sold by
Miller Helen
Bought by
Miller Helen and Helen Miller Trust
Purchase Details
Closed on
Oct 15, 1996
Sold by
Maas Maas Carleen J Carleen J and Maas Howard H
Bought by
Maas Maas Carleen J Carleen J and Maas Howard H
Purchase Details
Closed on
Jul 15, 1994
Sold by
Maas Howard H and Maas Howard
Bought by
Maas Howard H and Maas Carleen J
Create a Home Valuation Report for This Property
The Home Valuation Report is an in-depth analysis detailing your home's value as well as a comparison with similar homes in the area
Home Values in the Area
Average Home Value in this Area
Purchase History
| Date | Buyer | Sale Price | Title Company |
|---|---|---|---|
| 1999 Allen L Jackson And Debra L Jackson Revo | -- | None Listed On Document | |
| Jackson Allen L | -- | None Listed On Document | |
| Jackson Allen Lee | -- | None Listed On Document | |
| Jackson Helen M | -- | None Available | |
| Jackson Kenneth R | $600,000 | Fidelity National Title Co | |
| Miller Helen | -- | -- | |
| Maas Maas Carleen J Carleen J | -- | -- | |
| Maas Howard H | -- | -- |
Source: Public Records
Tax History Compared to Growth
Tax History
| Year | Tax Paid | Tax Assessment Tax Assessment Total Assessment is a certain percentage of the fair market value that is determined by local assessors to be the total taxable value of land and additions on the property. | Land | Improvement |
|---|---|---|---|---|
| 2025 | $6,284 | $551,412 | $218,484 | $332,928 |
| 2024 | $6,284 | $540,600 | $214,200 | $326,400 |
| 2023 | $6,284 | $417,620 | $194,888 | $222,732 |
| 2022 | $4,886 | $409,432 | $191,067 | $218,365 |
| 2021 | $4,847 | $401,405 | $187,321 | $214,084 |
| 2020 | $4,917 | $397,290 | $185,401 | $211,889 |
| 2019 | $4,854 | $389,501 | $181,766 | $207,735 |
| 2018 | $4,760 | $381,864 | $178,202 | $203,662 |
| 2017 | $4,680 | $374,377 | $174,708 | $199,669 |
| 2016 | $4,487 | $367,037 | $171,283 | $195,754 |
| 2015 | $4,377 | $361,525 | $168,711 | $192,814 |
| 2014 | $3,544 | $287,000 | $134,000 | $153,000 |
Source: Public Records
Map
Nearby Homes
- 530 Anson Ct
- 566 Santa Alicia Dr
- 7301 Willlowglen Dr
- 7316 Willowglen Dr
- 478 Santa Alicia Dr
- 77 Walnut Cir
- 746 Bernadette Ave
- 138 Walnut Cir
- 7530 Bernice Ave
- 229 Arlen Dr
- 950 Santa Alicia Dr
- 6440 Country Club Dr
- 7449 Adrian Dr
- 211 Apple Ln
- 21 Avram Ave
- 6469 Meadow Pines Ave
- 219 College View Dr
- 11 Avram Ave
- 928 Civic Center Dr
- 7103 Camino Colegio Unit 55