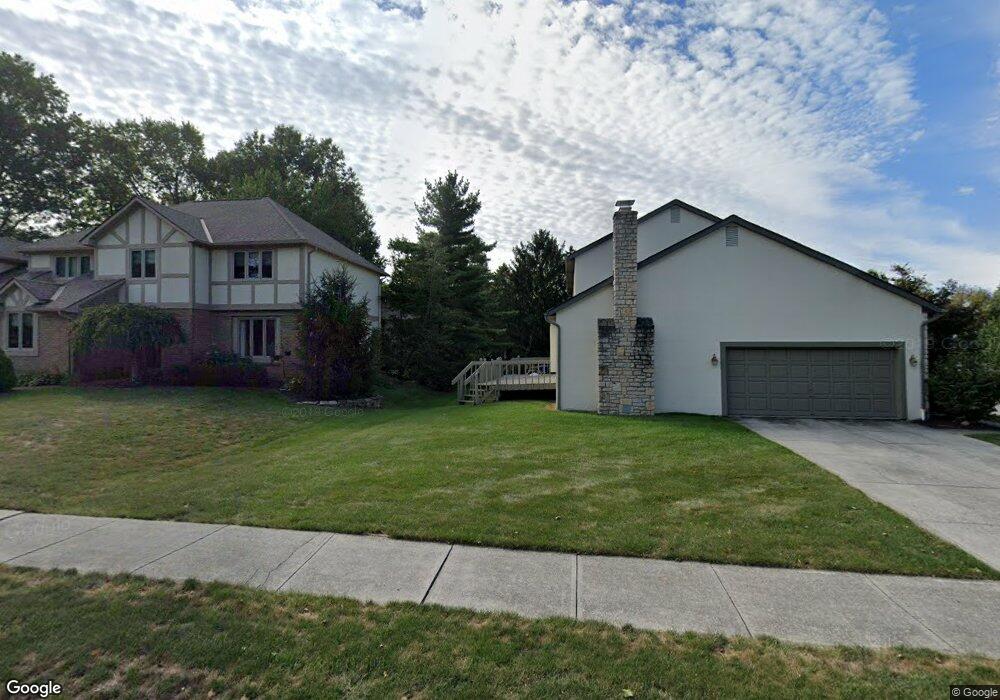
538 Deer Run Ct Westerville, OH 43081
Estimated Value: $502,179 - $540,000
4
Beds
4
Baths
2,350
Sq Ft
$220/Sq Ft
Est. Value
About This Home
This home is located at 538 Deer Run Ct, Westerville, OH 43081 and is currently estimated at $518,045, approximately $220 per square foot. 538 Deer Run Ct is a home located in Franklin County with nearby schools including Mcvay Elementary School, Walnut Springs Middle School, and Westerville-North High School.
Ownership History
Date
Name
Owned For
Owner Type
Purchase Details
Closed on
Jun 10, 2005
Sold by
Ferguson Shannon M
Bought by
Briley Deanna M
Current Estimated Value
Purchase Details
Closed on
Sep 8, 2004
Sold by
Campbell Brian J and Campbell Susan K
Bought by
Ferguson Shannon M and Briley Deanna M
Purchase Details
Closed on
Apr 19, 1985
Bought by
Campbell Brian J
Purchase Details
Closed on
Mar 1, 1984
Create a Home Valuation Report for This Property
The Home Valuation Report is an in-depth analysis detailing your home's value as well as a comparison with similar homes in the area
Home Values in the Area
Average Home Value in this Area
Purchase History
| Date | Buyer | Sale Price | Title Company |
|---|---|---|---|
| Briley Deanna M | $76,900 | Apex Title | |
| Ferguson Shannon M | $225,000 | -- | |
| Campbell Brian J | $32,500 | -- | |
| -- | -- | -- |
Source: Public Records
Tax History
| Year | Tax Paid | Tax Assessment Tax Assessment Total Assessment is a certain percentage of the fair market value that is determined by local assessors to be the total taxable value of land and additions on the property. | Land | Improvement |
|---|---|---|---|---|
| 2025 | $8,655 | $152,290 | $33,250 | $119,040 |
| 2024 | $8,655 | $152,290 | $33,250 | $119,040 |
| 2023 | $8,471 | $152,285 | $33,250 | $119,035 |
| 2022 | $8,114 | $111,370 | $21,000 | $90,370 |
| 2021 | $8,182 | $111,370 | $21,000 | $90,370 |
| 2020 | $8,159 | $111,370 | $21,000 | $90,370 |
| 2019 | $7,168 | $92,370 | $17,500 | $74,870 |
| 2018 | $6,702 | $92,370 | $17,500 | $74,870 |
| 2017 | $6,817 | $92,370 | $17,500 | $74,870 |
| 2016 | $6,585 | $78,540 | $18,900 | $59,640 |
| 2015 | $6,378 | $78,540 | $18,900 | $59,640 |
| 2014 | $6,382 | $78,540 | $18,900 | $59,640 |
| 2013 | $3,035 | $74,795 | $17,990 | $56,805 |
Source: Public Records
Map
Nearby Homes
- 1114 Forest View Ct
- 613 Deer Run Rd
- 1151 Scarlet Ct
- 672 Liberty Ln
- 689 Liberty Ln
- 45 Kanpur Place
- 636 E Schrock Rd
- 612 E Schrock Rd
- 215 Mainsail Dr
- 868 Liverpool Place
- 124 Mainsail Dr
- 862 Thirlwall Ct
- 392 Hickory Ln
- 487 Beachside Dr
- 961 E College Ave
- 974 Timberbank Dr
- 322 Huber Village Blvd
- 703 Pointview Dr
- 321 Northgate Ct Unit B
- 270 Brisbane Ave
- 1101 Woodglen Rd
- 514 Deer Run Ct
- 535 Deer Run Ct
- 1096 Forest Glen Rd
- 506 Deer Run Ct
- 519 Deer Run Ct
- 1100 Forest Glen Rd
- 511 Deer Run Ct
- 527 Deer Run Ct
- 538 Deer Run Rd
- 1096 Woodglen Rd
- 1104 Forest Glen Rd
- 498 Deer Run Ct
- 503 Deer Run Ct
- 535 Deer Run Rd
- 1088 Woodglen Rd
- 1108 Forest Glen Rd
- 1080 Woodglen Rd
- 495 Deer Run Ct
- 543 Deer Run Rd
Your Personal Tour Guide
Ask me questions while you tour the home.