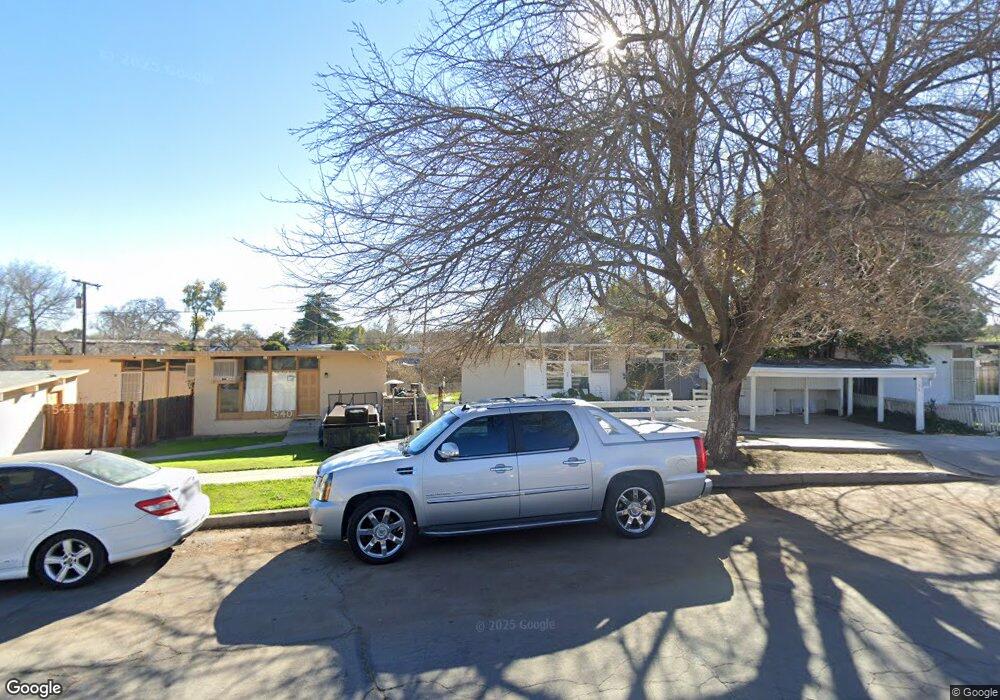
538 Ferro Ln Paso Robles, CA 93446
Estimated Value: $585,228 - $655,000
4
Beds
2
Baths
1,664
Sq Ft
$375/Sq Ft
Est. Value
About This Home
This home is located at 538 Ferro Ln, Paso Robles, CA 93446 and is currently estimated at $624,557, approximately $375 per square foot. 538 Ferro Ln is a home located in San Luis Obispo County with nearby schools including Winifred Pifer Elementary School, Daniel Lewis Middle School, and Paso Robles High School.
Ownership History
Date
Name
Owned For
Owner Type
Purchase Details
Closed on
Nov 18, 2003
Sold by
Smiley Rodney L
Bought by
Muir Rosalva
Current Estimated Value
Purchase Details
Closed on
Mar 22, 2001
Sold by
Scott Milford M and Scott Eleanor V
Bought by
Muir Rosalva
Home Financials for this Owner
Home Financials are based on the most recent Mortgage that was taken out on this home.
Original Mortgage
$87,000
Outstanding Balance
$31,584
Interest Rate
6.98%
Estimated Equity
$592,973
Purchase Details
Closed on
Sep 11, 1995
Sold by
Scott Milford M and Scott Eleanor V
Bought by
Scott Milford M and Scott Eleanor V
Create a Home Valuation Report for This Property
The Home Valuation Report is an in-depth analysis detailing your home's value as well as a comparison with similar homes in the area
Purchase History
| Date | Buyer | Sale Price | Title Company |
|---|---|---|---|
| Muir Rosalva | -- | First American Title Company | |
| Muir Rosalva | $125,000 | First American Title Ins Co | |
| Scott Milford M | -- | -- |
Source: Public Records
Mortgage History
| Date | Status | Borrower | Loan Amount |
|---|---|---|---|
| Open | Muir Rosalva | $87,000 |
Source: Public Records
Tax History
| Year | Tax Paid | Tax Assessment Tax Assessment Total Assessment is a certain percentage of the fair market value that is determined by local assessors to be the total taxable value of land and additions on the property. | Land | Improvement |
|---|---|---|---|---|
| 2025 | $2,053 | $188,328 | $82,863 | $105,465 |
| 2024 | $2,019 | $184,637 | $81,239 | $103,398 |
| 2023 | $2,019 | $181,018 | $79,647 | $101,371 |
| 2022 | $1,989 | $177,470 | $78,086 | $99,384 |
| 2021 | $1,955 | $173,991 | $76,555 | $97,436 |
| 2020 | $1,929 | $172,208 | $75,771 | $96,437 |
| 2019 | $1,901 | $168,833 | $74,286 | $94,547 |
| 2018 | $1,876 | $165,524 | $72,830 | $92,694 |
| 2017 | $1,764 | $162,279 | $71,402 | $90,877 |
| 2016 | $1,729 | $159,098 | $70,002 | $89,096 |
| 2015 | $1,723 | $156,709 | $68,951 | $87,758 |
| 2014 | $1,663 | $153,640 | $67,601 | $86,039 |
Source: Public Records
Map
Nearby Homes
Your Personal Tour Guide
Ask me questions while you tour the home.