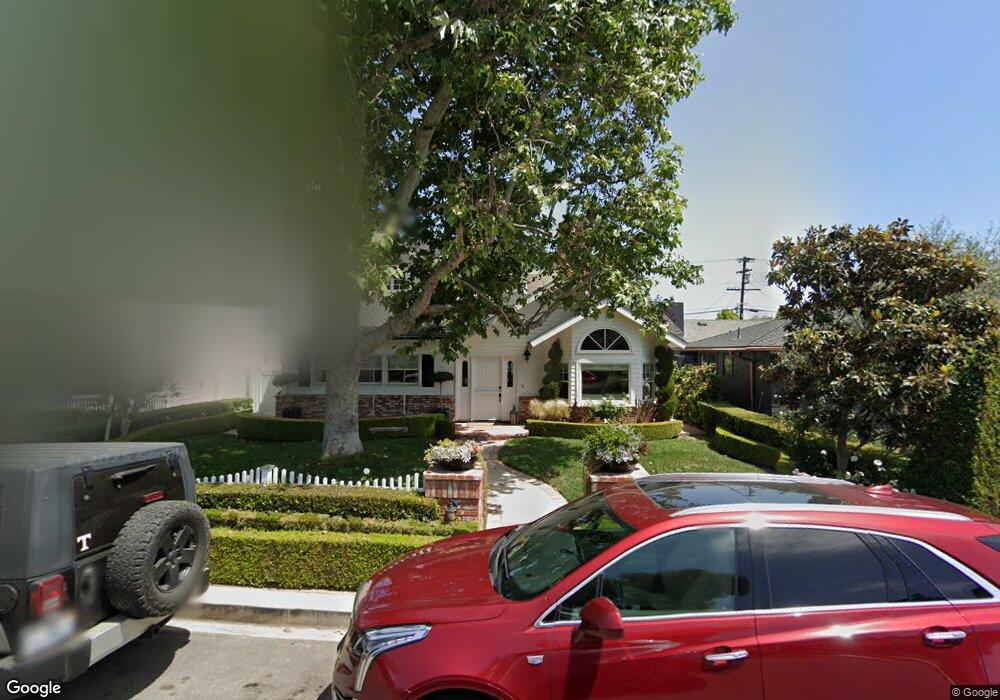
538 Fullerton Ave Newport Beach, CA 92663
Newport Heights NeighborhoodEstimated Value: $3,599,000 - $5,251,000
4
Beds
4
Baths
3,436
Sq Ft
$1,335/Sq Ft
Est. Value
About This Home
This home is located at 538 Fullerton Ave, Newport Beach, CA 92663 and is currently estimated at $4,585,525, approximately $1,334 per square foot. 538 Fullerton Ave is a home located in Orange County with nearby schools including Newport Heights Elementary, Horace Ensign Intermediate School, and Newport Harbor High School.
Ownership History
Date
Name
Owned For
Owner Type
Purchase Details
Closed on
Jan 18, 2022
Sold by
Albrecht and Michelle
Bought by
2022 Albrecht Family Trust
Current Estimated Value
Purchase Details
Closed on
Apr 17, 2003
Sold by
Jones Thomas N and Jones Terri P
Bought by
Albrecht Scott and Albrecht Michelle
Home Financials for this Owner
Home Financials are based on the most recent Mortgage that was taken out on this home.
Original Mortgage
$710,000
Interest Rate
4.37%
Mortgage Type
Purchase Money Mortgage
Purchase Details
Closed on
Dec 4, 2000
Sold by
Munson Duane K and Munson Glenda G
Bought by
Jones Thomas N and Jones Terri P
Home Financials for this Owner
Home Financials are based on the most recent Mortgage that was taken out on this home.
Original Mortgage
$736,000
Interest Rate
7%
Create a Home Valuation Report for This Property
The Home Valuation Report is an in-depth analysis detailing your home's value as well as a comparison with similar homes in the area
Home Values in the Area
Average Home Value in this Area
Purchase History
| Date | Buyer | Sale Price | Title Company |
|---|---|---|---|
| 2022 Albrecht Family Trust | -- | None Listed On Document | |
| Albrecht Scott | $1,065,000 | Equity Title Company | |
| Jones Thomas N | $920,000 | Equity Title Company |
Source: Public Records
Mortgage History
| Date | Status | Borrower | Loan Amount |
|---|---|---|---|
| Previous Owner | Albrecht Scott | $710,000 | |
| Previous Owner | Jones Thomas N | $736,000 | |
| Closed | Jones Thomas N | $92,000 |
Source: Public Records
Tax History Compared to Growth
Tax History
| Year | Tax Paid | Tax Assessment Tax Assessment Total Assessment is a certain percentage of the fair market value that is determined by local assessors to be the total taxable value of land and additions on the property. | Land | Improvement |
|---|---|---|---|---|
| 2025 | $16,583 | $1,576,584 | $1,325,520 | $251,064 |
| 2024 | $16,583 | $1,545,671 | $1,299,529 | $246,142 |
| 2023 | $16,192 | $1,515,364 | $1,274,048 | $241,316 |
| 2022 | $15,921 | $1,485,651 | $1,249,066 | $236,585 |
| 2021 | $15,615 | $1,456,521 | $1,224,574 | $231,947 |
| 2020 | $15,464 | $1,441,587 | $1,212,018 | $229,569 |
| 2019 | $15,145 | $1,413,321 | $1,188,253 | $225,068 |
| 2018 | $14,843 | $1,385,609 | $1,164,954 | $220,655 |
| 2017 | $14,580 | $1,358,441 | $1,142,112 | $216,329 |
| 2016 | $14,252 | $1,331,805 | $1,119,717 | $212,088 |
| 2015 | $14,116 | $1,311,801 | $1,102,898 | $208,903 |
| 2014 | $13,782 | $1,286,105 | $1,081,294 | $204,811 |
Source: Public Records
Map
Nearby Homes
- 600 Powell Place
- 1705 Haven Place Unit 1
- 1805 Clay St
- 430 Aliso Ave
- 2217 Laurel Place
- 321 Fullerton Ave
- 387 La Perle Place
- 411 Snug Harbor Rd
- 421 Tustin Ave
- 401 Snug Harbor Rd
- 1596 Riverside Place
- 411 Lenwood Dr
- 1594 Redlands Place
- 230 Ocean View Ave
- 702 Saint James Place
- 465 Santa Ana Ave
- 2907 Cliff Dr
- 212 Kings Place
- 510 Catalina Dr
- 427 Santa Ana Ave
- 542 Fullerton Ave
- 532 Fullerton Ave
- 546 Fullerton Ave
- 530 Fullerton Ave
- 539 Irvine Ave
- 526 Fullerton Ave
- 545 Irvine Ave
- 533 Irvine Ave
- 549 Irvine Ave
- 531 Irvine Ave
- 539 Fullerton Ave
- 535 Fullerton Ave
- 543 Fullerton Ave
- 522 Fullerton Ave
- 527 Irvine Ave
- 531 Fullerton Ave
- 2301 E 15th St
- 600 Michael Place
- 601 Michael Place
- 525 Fullerton Ave