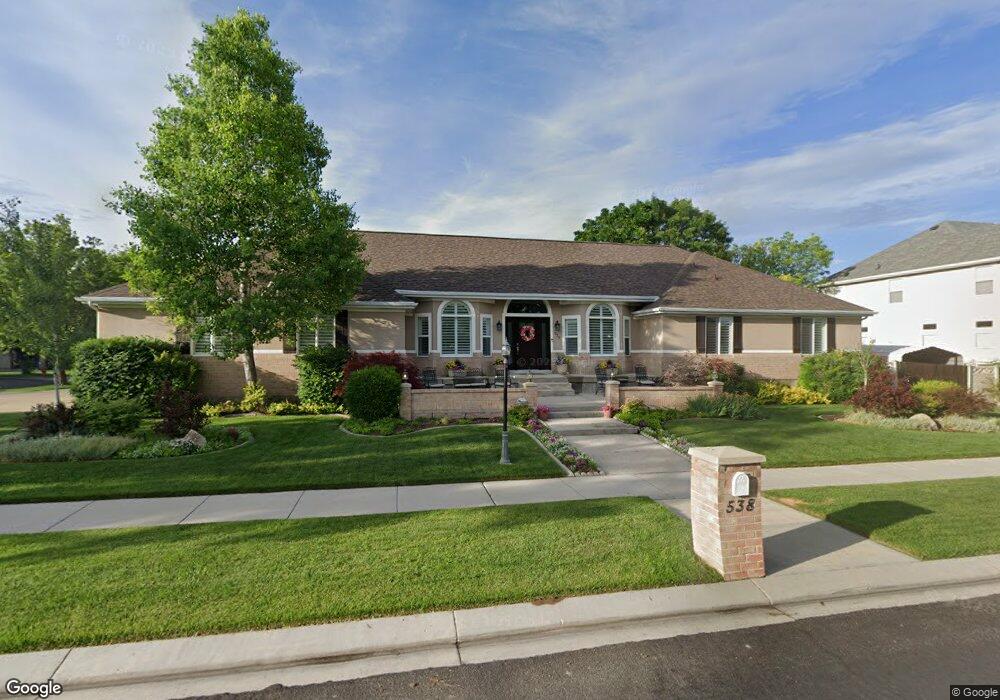
538 Pheasant View Dr Draper, UT 84020
Estimated Value: $880,000 - $993,284
4
Beds
3
Baths
2,306
Sq Ft
$412/Sq Ft
Est. Value
About This Home
This home is located at 538 Pheasant View Dr, Draper, UT 84020 and is currently estimated at $950,321, approximately $412 per square foot. 538 Pheasant View Dr is a home located in Salt Lake County with nearby schools including Corner Canyon High School, Draper Park Middle School, and Channing Hall.
Ownership History
Date
Name
Owned For
Owner Type
Purchase Details
Closed on
Aug 1, 2001
Sold by
Bankers Trust Company
Bought by
Finley Jeffrey and Finley Dixie D
Current Estimated Value
Home Financials for this Owner
Home Financials are based on the most recent Mortgage that was taken out on this home.
Original Mortgage
$142,000
Outstanding Balance
$55,192
Interest Rate
7.1%
Estimated Equity
$895,129
Purchase Details
Closed on
Nov 15, 2000
Sold by
Pham Sy Tan and Pham Jane Miner
Bought by
Bankers Trust Company
Purchase Details
Closed on
Aug 21, 1996
Sold by
Klassen Marilyn J and Wilt Jennifer L Vander
Bought by
Pham Sy Tan and Pham Jane Miner
Purchase Details
Closed on
Oct 27, 1995
Sold by
Klassen Marilyn J and Vander Wilt Jennifer L
Bought by
Pham Sy Tan and Pham Jane Miner
Home Financials for this Owner
Home Financials are based on the most recent Mortgage that was taken out on this home.
Original Mortgage
$175,982
Interest Rate
7.59%
Purchase Details
Closed on
Dec 27, 1993
Sold by
Mcwood Cannon Ii Lc
Bought by
Klassen Marilyn J and Vanderwilt Jennifer L
Create a Home Valuation Report for This Property
The Home Valuation Report is an in-depth analysis detailing your home's value as well as a comparison with similar homes in the area
Home Values in the Area
Average Home Value in this Area
Purchase History
| Date | Buyer | Sale Price | Title Company |
|---|---|---|---|
| Finley Jeffrey | -- | Title West | |
| Bankers Trust Company | $342,072 | Backman Stewart Title Servic | |
| Pham Sy Tan | -- | -- | |
| Pham Sy Tan | -- | -- | |
| Klassen Marilyn J | -- | -- |
Source: Public Records
Mortgage History
| Date | Status | Borrower | Loan Amount |
|---|---|---|---|
| Open | Finley Jeffrey | $142,000 | |
| Previous Owner | Pham Sy Tan | $175,982 |
Source: Public Records
Tax History
| Year | Tax Paid | Tax Assessment Tax Assessment Total Assessment is a certain percentage of the fair market value that is determined by local assessors to be the total taxable value of land and additions on the property. | Land | Improvement |
|---|---|---|---|---|
| 2025 | $4,219 | $839,000 | $300,400 | $538,600 |
| 2024 | $4,219 | $805,900 | $289,300 | $516,600 |
| 2023 | $4,190 | $794,500 | $265,300 | $529,200 |
| 2022 | $4,420 | $809,600 | $260,100 | $549,500 |
| 2021 | $3,800 | $594,600 | $245,100 | $349,500 |
| 2020 | $3,657 | $542,400 | $215,000 | $327,400 |
| 2019 | $3,779 | $547,700 | $215,000 | $332,700 |
| 2016 | $3,413 | $470,600 | $180,700 | $289,900 |
Source: Public Records
Map
Nearby Homes
- 13208 Sunset Glen Way
- 13160 S 300 E
- 847 E Willow Springs Ln
- 633 E Vandalay Ln
- 13176 Day Ct
- 265 E 13275 S
- 902 E 12650 S
- 12959 S Fort St
- 13520 S Lone Rock Dr
- 352 E Mistilake Ln Unit 20
- 311 E Unchartered Ln
- 13216 S Telemark Ln
- 224 E Spencer Peak Way Unit F-4
- 208 Spencer Peak Way Unit E2
- 296 E Ireland Ln Unit 101
- 12062 S 540 E
- 963 Old English Rd
- 13469 S Mule Creek Cove
- 261 E Concord Farm Ln Unit 6
- 528 E 13710 S
- 538 E Pheasant View Dr
- 12944 Pheasant Moor Cove
- 12944 S Pheasant Moor Cove
- 514 Pheasant View Dr
- 539 Pheasant View Dr
- 539 E Pheasant View Dr
- 523 E Pheasant View Dr
- 523 Pheasant View Dr
- 517 Golden Pheasant Dr
- 517 E Golden Pheasant Dr
- 12943 Pheasant Moor Cove
- 12943 S Pheasant Moor Cove
- 12937 Pheasant Moor Cove
- 12937 S Pheasant Moor Cove
- 507 Golden Pheasant Dr
- 498 Pheasant View Dr
- 531 Golden Pheasant Dr
- 507 Pheasant View Dr
- 507 E Pheasant View Dr
- 567 E Pheasant View Dr
Your Personal Tour Guide
Ask me questions while you tour the home.