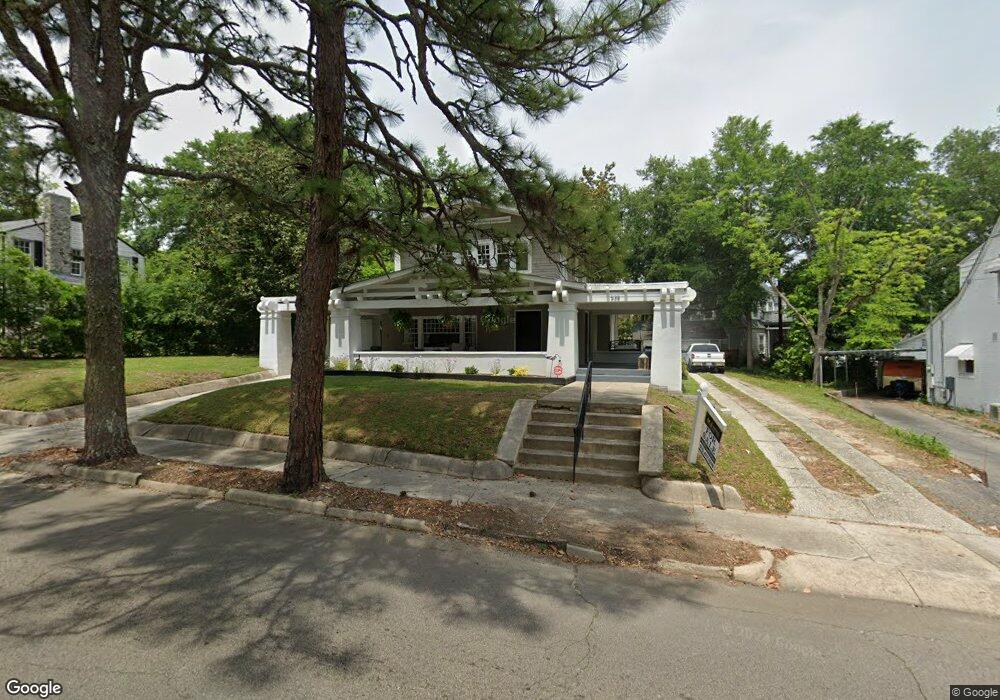
538 W Main St Hamlet, NC 28345
Estimated Value: $259,000 - $286,204
4
Beds
2
Baths
2,509
Sq Ft
$111/Sq Ft
Est. Value
About This Home
This home is located at 538 W Main St, Hamlet, NC 28345 and is currently estimated at $277,551, approximately $110 per square foot. 538 W Main St is a home located in Richmond County with nearby schools including Monroe Avenue Elementary School, Hamlet Middle School, and Ashley Chapel Educational Center.
Ownership History
Date
Name
Owned For
Owner Type
Purchase Details
Closed on
Jan 16, 2025
Sold by
Martin Mark and Martin Destiny
Bought by
Smith Corey Blake
Current Estimated Value
Home Financials for this Owner
Home Financials are based on the most recent Mortgage that was taken out on this home.
Original Mortgage
$264,344
Outstanding Balance
$262,465
Interest Rate
6.69%
Mortgage Type
VA
Estimated Equity
$15,086
Purchase Details
Closed on
Nov 10, 2021
Sold by
Reel Properties Llc
Bought by
Martin Mark and Martin Destiny
Home Financials for this Owner
Home Financials are based on the most recent Mortgage that was taken out on this home.
Original Mortgage
$245,000
Interest Rate
2.99%
Mortgage Type
New Conventional
Purchase Details
Closed on
Jun 15, 2021
Sold by
Taylor Heath Anne
Bought by
Reel Properties Llc
Purchase Details
Closed on
Jun 15, 1994
Bought by
Johnson Anne T
Create a Home Valuation Report for This Property
The Home Valuation Report is an in-depth analysis detailing your home's value as well as a comparison with similar homes in the area
Home Values in the Area
Average Home Value in this Area
Purchase History
| Date | Buyer | Sale Price | Title Company |
|---|---|---|---|
| Smith Corey Blake | $256,000 | None Listed On Document | |
| Smith Corey Blake | $256,000 | None Listed On Document | |
| Martin Mark | $245,000 | Chicago Title Insurance Co | |
| Reel Properties Llc | $65,000 | None Listed On Document | |
| Johnson Anne T | $30,000 | -- |
Source: Public Records
Mortgage History
| Date | Status | Borrower | Loan Amount |
|---|---|---|---|
| Open | Smith Corey Blake | $264,344 | |
| Closed | Smith Corey Blake | $264,344 | |
| Previous Owner | Martin Mark | $245,000 |
Source: Public Records
Tax History Compared to Growth
Tax History
| Year | Tax Paid | Tax Assessment Tax Assessment Total Assessment is a certain percentage of the fair market value that is determined by local assessors to be the total taxable value of land and additions on the property. | Land | Improvement |
|---|---|---|---|---|
| 2025 | $2,292 | $295,709 | $8,236 | $287,473 |
| 2024 | $2,351 | $295,709 | $8,236 | $287,473 |
| 2023 | $949 | $98,792 | $6,589 | $92,203 |
| 2022 | $949 | $98,792 | $6,589 | $92,203 |
| 2021 | $945 | $98,792 | $6,589 | $92,203 |
| 2020 | $475 | $98,792 | $6,589 | $92,203 |
| 2019 | $475 | $98,792 | $6,589 | $92,203 |
| 2018 | $475 | $98,792 | $6,589 | $92,203 |
| 2016 | $493 | $108,926 | $6,589 | $102,337 |
| 2014 | -- | $97,538 | $5,725 | $91,813 |
Source: Public Records
Map
Nearby Homes
- 538 Main St
- 203 Minturn Ave
- 515 McDonald Ave
- 401 Marlboro St
- 0 Hylan
- 304 Henderson St
- 207 Rice St
- 408 Jefferson St
- 409 Myrtle Ave
- 202 W West Main St W
- 212 Richmond Ave
- 509 Champlain St
- 607 Henderson St
- 303 Dogwood Ln
- 507 Hylan Ave
- 1100 McDonald Ave
- 1 Woodlawn Ave
- 817 Austin St
- 318 Spring St
- 904 Austin St
- 504 Main St E
- 542 W Main St
- 107 Bauersfeld St
- 105 Bauersfeld St
- 544 W Main St
- 109 Bauersfeld St
- 537 W Main St
- 535 W Main St
- 541 W Main St
- 111 Bauersfeld St
- 543 W Main St
- 505 W Main St
- 106 Bauersfeld St
- 108 Bauersfeld St
- 104 Bauersfeld St
- 503 W Main St
- 415 Entwistle St
- 545 W Main St
- 113 Bauersfeld St
- 419 Entwistle St