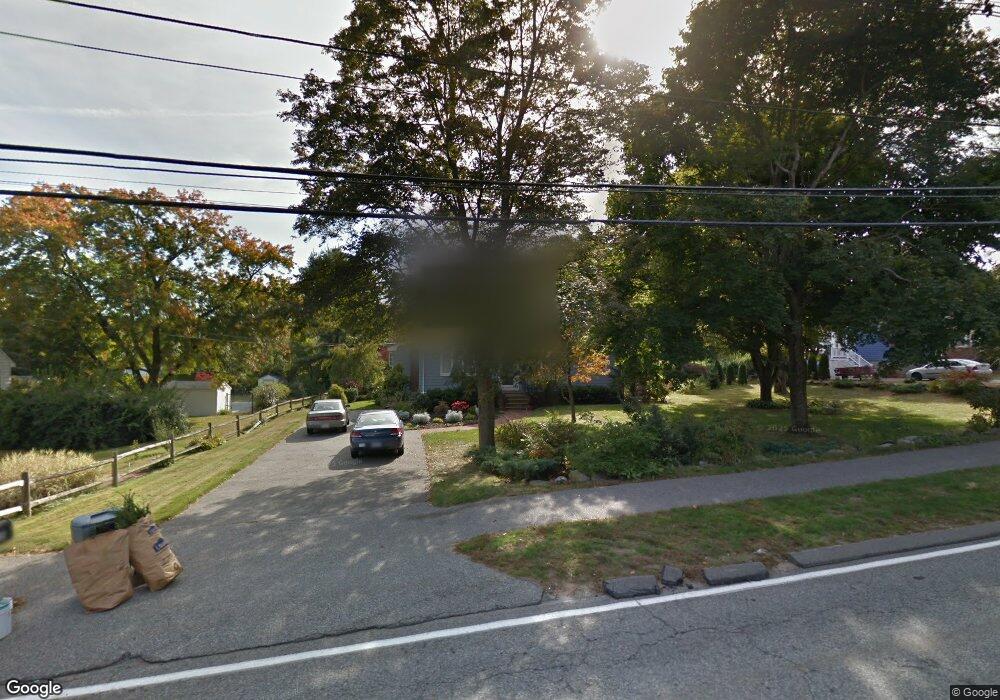
538 Woburn St Wilmington, MA 01887
Estimated Value: $607,000 - $724,000
3
Beds
1
Bath
1,008
Sq Ft
$664/Sq Ft
Est. Value
About This Home
This home is located at 538 Woburn St, Wilmington, MA 01887 and is currently estimated at $669,664, approximately $664 per square foot. 538 Woburn St is a home located in Middlesex County with nearby schools including Wilmington Middle School, Wilmington High School, and Abundant Life Christian School and Childcare.
Ownership History
Date
Name
Owned For
Owner Type
Purchase Details
Closed on
Feb 27, 2006
Sold by
538 Woburn St T
Bought by
Shibilia Joanne
Current Estimated Value
Home Financials for this Owner
Home Financials are based on the most recent Mortgage that was taken out on this home.
Original Mortgage
$284,000
Outstanding Balance
$160,505
Interest Rate
6.17%
Mortgage Type
Purchase Money Mortgage
Estimated Equity
$509,159
Purchase Details
Closed on
Sep 30, 2003
Sold by
Kurowski Richard E and Kurowski Sandra R
Bought by
538 Woburn St Nt
Create a Home Valuation Report for This Property
The Home Valuation Report is an in-depth analysis detailing your home's value as well as a comparison with similar homes in the area
Home Values in the Area
Average Home Value in this Area
Purchase History
| Date | Buyer | Sale Price | Title Company |
|---|---|---|---|
| Shibilia Joanne | $355,000 | -- | |
| 538 Woburn St Nt | -- | -- |
Source: Public Records
Mortgage History
| Date | Status | Borrower | Loan Amount |
|---|---|---|---|
| Open | Shibilia Joanne | $284,000 |
Source: Public Records
Tax History Compared to Growth
Tax History
| Year | Tax Paid | Tax Assessment Tax Assessment Total Assessment is a certain percentage of the fair market value that is determined by local assessors to be the total taxable value of land and additions on the property. | Land | Improvement |
|---|---|---|---|---|
| 2025 | $5,986 | $522,800 | $282,600 | $240,200 |
| 2024 | $5,697 | $498,400 | $282,600 | $215,800 |
| 2023 | $5,519 | $462,200 | $257,000 | $205,200 |
| 2022 | $5,228 | $401,200 | $214,100 | $187,100 |
| 2021 | $5,429 | $392,300 | $194,600 | $197,700 |
| 2020 | $5,192 | $382,300 | $194,600 | $187,700 |
| 2019 | $5,143 | $374,000 | $185,300 | $188,700 |
| 2018 | $4,811 | $333,900 | $176,500 | $157,400 |
| 2017 | $4,664 | $322,800 | $176,500 | $146,300 |
| 2016 | $4,471 | $305,600 | $168,200 | $137,400 |
| 2015 | $4,231 | $294,400 | $168,200 | $126,200 |
| 2014 | $4,020 | $282,300 | $160,200 | $122,100 |
Source: Public Records
Map
Nearby Homes
- 1 March Rd
- 5 Flynn Way
- 17 Molloy Rd
- 3 Strout Ave
- 203 Lowell St Unit 119
- 203 Lowell St Unit 115
- 203 Lowell St Unit 220
- 203 Lowell St Unit 103
- 9 Parker St
- 27 Fairview Ave
- 7 Cross St Unit 306
- 7 Cross St Unit 304
- 7 Cross St Unit 205
- 61 Lowell St
- 5 Morse Ave
- 11 Patchs Pond Ln
- 452 Lowell St
- 3 Bradford Rd
- 12 Hamlin Ln
- 3 Oakdale Rd
- 536 Woburn St
- 540 Woburn St
- 7 Redwood Terrace
- 563 Woburn St
- 565 Woburn St
- 534 Woburn St
- 561 Woburn St
- 9 Redwood Terrace
- 5 Redwood Terrace
- 542 Woburn St
- 571 Woburn St
- 532 Woburn St
- 216 Wildwood St
- 216 Wildwood St Unit ,0
- 2 Wing Rd
- 11 Redwood Terrace
- 1 Wing Rd
- 210 Wildwood St
- 557 Woburn St
- 3 Redwood Terrace