5380 Foothill Blvd Oakland, CA 94601
Melrose Heights NeighborhoodEstimated Value: $578,000 - $802,000
3
Beds
2
Baths
1,717
Sq Ft
$402/Sq Ft
Est. Value
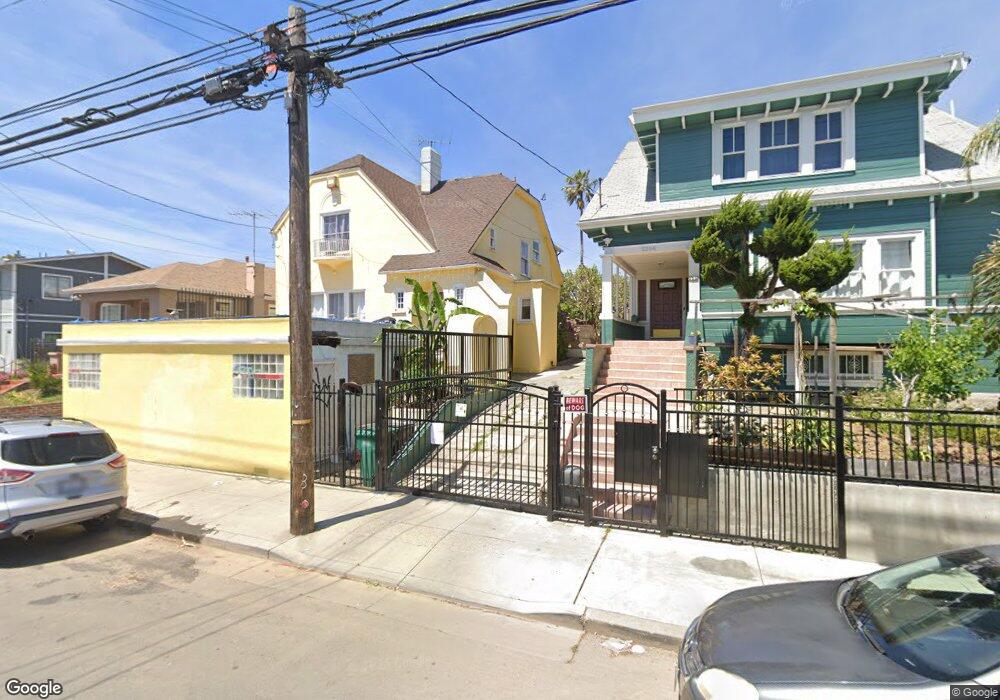
About This Home
This home is located at 5380 Foothill Blvd, Oakland, CA 94601 and is currently estimated at $689,790, approximately $401 per square foot. 5380 Foothill Blvd is a home located in Alameda County with nearby schools including Horace Mann Elementary School, Frick United Academy of Language, and Fremont High School.
Ownership History
Date
Name
Owned For
Owner Type
Purchase Details
Closed on
Feb 6, 2016
Sold by
Chhom Petros T and Chhom Sony
Bought by
Chhom Petros T and Chhom Sony
Current Estimated Value
Purchase Details
Closed on
Nov 17, 1999
Sold by
Croft Kent C and Croft Bonnie K
Bought by
Chhom Petros T and Chhom Sony
Home Financials for this Owner
Home Financials are based on the most recent Mortgage that was taken out on this home.
Original Mortgage
$90,000
Outstanding Balance
$27,665
Interest Rate
7.84%
Estimated Equity
$662,125
Purchase Details
Closed on
Jan 17, 1999
Sold by
Bramwell Albert K Living Trust and Jean Thora
Bought by
Croft Kent C and Croft Bonnie K
Home Financials for this Owner
Home Financials are based on the most recent Mortgage that was taken out on this home.
Original Mortgage
$65,000
Interest Rate
6.79%
Purchase Details
Closed on
Aug 26, 1994
Sold by
Bramwell A K
Bought by
Bramwell Albert K and Albert K Bramwell Living Trust
Create a Home Valuation Report for This Property
The Home Valuation Report is an in-depth analysis detailing your home's value as well as a comparison with similar homes in the area
Home Values in the Area
Average Home Value in this Area
Purchase History
| Date | Buyer | Sale Price | Title Company |
|---|---|---|---|
| Chhom Petros T | -- | None Available | |
| Chhom Petros T | $130,000 | Old Republic Title Company | |
| Croft Kent C | $65,000 | First American Title Ins Co | |
| Bramwell Albert K | -- | -- |
Source: Public Records
Mortgage History
| Date | Status | Borrower | Loan Amount |
|---|---|---|---|
| Open | Chhom Petros T | $90,000 | |
| Previous Owner | Croft Kent C | $65,000 |
Source: Public Records
Tax History Compared to Growth
Tax History
| Year | Tax Paid | Tax Assessment Tax Assessment Total Assessment is a certain percentage of the fair market value that is determined by local assessors to be the total taxable value of land and additions on the property. | Land | Improvement |
|---|---|---|---|---|
| 2025 | $4,315 | $199,641 | $59,938 | $139,703 |
| 2024 | $4,315 | $195,727 | $58,763 | $136,964 |
| 2023 | $4,431 | $191,890 | $57,611 | $134,279 |
| 2022 | $4,258 | $188,128 | $56,482 | $131,646 |
| 2021 | $3,950 | $184,440 | $55,374 | $129,066 |
| 2020 | $3,906 | $182,550 | $54,807 | $127,743 |
| 2019 | $3,683 | $178,972 | $53,733 | $125,239 |
| 2018 | $3,610 | $175,463 | $52,679 | $122,784 |
| 2017 | $3,444 | $172,023 | $51,646 | $120,377 |
| 2016 | $3,258 | $168,651 | $50,634 | $118,017 |
| 2015 | $5,715 | $166,117 | $49,873 | $116,244 |
| 2014 | $3,187 | $162,864 | $48,897 | $113,967 |
Source: Public Records
Map
Nearby Homes
- 5315 Cole St
- 5431 Ygnacio Ave
- 5444 Bancroft Ave
- 5226 Belvedere St
- 5103 Fairfax Ave
- 1830 Vicksburg Ave
- 5553 Harvey Ave
- 2622 Kingsland Ave
- 5169 Trask St
- 5421 Wentworth Ave
- 5600 Foothill Blvd
- 2007 57th Ave
- 2100 51st Ave
- 2426 57th Ave
- 2125 51st Ave
- 5217 Bancroft Ave
- 5483 Wadean Place
- 5540 E 17th St
- 5706 Brookdale Ave
- 5318 Fleming Ave
- 5394 Foothill Blvd
- 5362 Foothill Blvd
- 5335 Cole St
- 5321 Cole St
- 5324 Belvedere St
- 5338 Belvedere St Unit D
- 5338 Belvedere St Unit C
- 5338 Belvedere St
- 5320 Belvedere St
- 5314 Belvedere St
- 5305 Cole St
- 5353 Ygnacio Ave
- 5320 Cole St
- 5400 Foothill Blvd
- 5353 Foothill Blvd
- 5404 Foothill Blvd
- 5415 Cole St
- 5316 Cole St
- 5308 Cole St
- 5408 Foothill Blvd