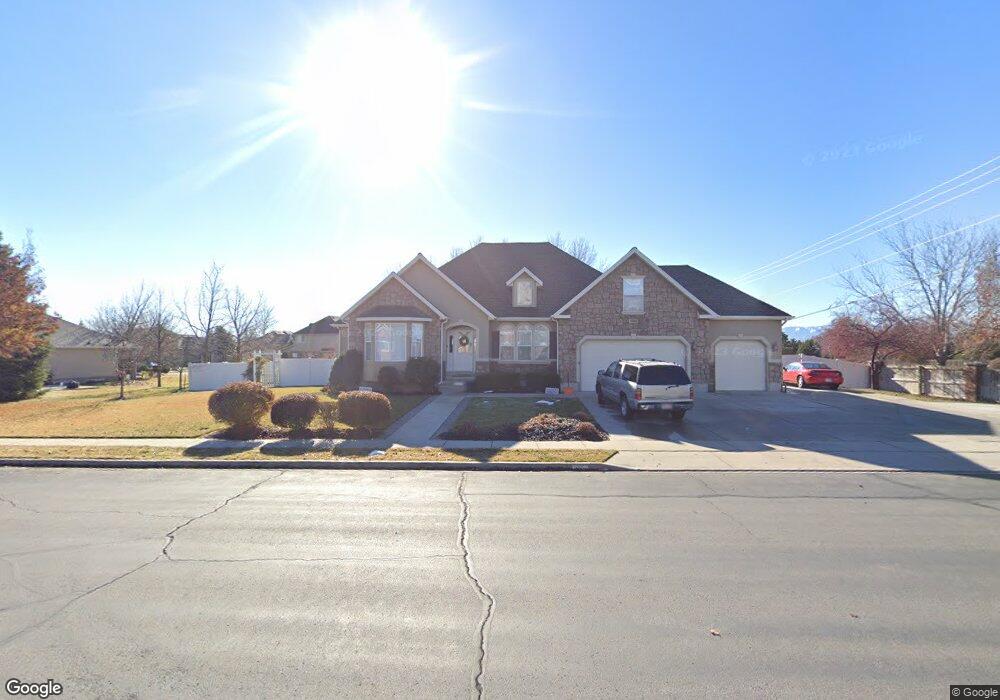
5381 W 10130 N Highland, UT 84003
Estimated Value: $1,104,000 - $1,466,837
7
Beds
6
Baths
4,760
Sq Ft
$269/Sq Ft
Est. Value
About This Home
This home is located at 5381 W 10130 N, Highland, UT 84003 and is currently estimated at $1,282,459, approximately $269 per square foot. 5381 W 10130 N is a home located in Utah County with nearby schools including Highland Elementary School, Mountain Ridge Junior High School, and Lone Peak High School.
Ownership History
Date
Name
Owned For
Owner Type
Purchase Details
Closed on
Oct 1, 2015
Sold by
Summers David G and Summers Julie C
Bought by
Hunsaker Donald Lee and Hunsaker Maria
Current Estimated Value
Home Financials for this Owner
Home Financials are based on the most recent Mortgage that was taken out on this home.
Original Mortgage
$454,520
Outstanding Balance
$357,733
Interest Rate
3.89%
Mortgage Type
VA
Estimated Equity
$924,726
Purchase Details
Closed on
Jun 20, 2001
Sold by
Klemetson Glenn
Bought by
Summers David G and Summers Julie C
Home Financials for this Owner
Home Financials are based on the most recent Mortgage that was taken out on this home.
Original Mortgage
$295,000
Interest Rate
7.15%
Create a Home Valuation Report for This Property
The Home Valuation Report is an in-depth analysis detailing your home's value as well as a comparison with similar homes in the area
Home Values in the Area
Average Home Value in this Area
Purchase History
| Date | Buyer | Sale Price | Title Company |
|---|---|---|---|
| Hunsaker Donald Lee | -- | Highland Title | |
| Summers David G | -- | Old Republic Title Company |
Source: Public Records
Mortgage History
| Date | Status | Borrower | Loan Amount |
|---|---|---|---|
| Open | Hunsaker Donald Lee | $454,520 | |
| Previous Owner | Summers David G | $295,000 |
Source: Public Records
Tax History Compared to Growth
Tax History
| Year | Tax Paid | Tax Assessment Tax Assessment Total Assessment is a certain percentage of the fair market value that is determined by local assessors to be the total taxable value of land and additions on the property. | Land | Improvement |
|---|---|---|---|---|
| 2025 | $5,550 | $787,490 | $564,500 | $867,300 |
| 2024 | $5,550 | $685,465 | $0 | $0 |
| 2023 | $5,289 | $704,715 | $0 | $0 |
| 2022 | $4,923 | $636,020 | $0 | $0 |
| 2021 | $4,181 | $804,600 | $301,300 | $503,300 |
| 2020 | $4,055 | $765,300 | $262,000 | $503,300 |
| 2019 | $3,744 | $739,100 | $235,800 | $503,300 |
| 2018 | $3,753 | $704,200 | $200,900 | $503,300 |
| 2017 | $3,604 | $360,910 | $0 | $0 |
| 2016 | $3,572 | $334,290 | $0 | $0 |
| 2015 | -- | $317,460 | $0 | $0 |
| 2014 | $3,181 | $279,730 | $0 | $0 |
Source: Public Records
Map
Nearby Homes
- 5378 W 10130 N
- 10261 N 5230 W
- 5586 W 10130 N
- 10531 N Alpine Hwy
- 10197 N 5750 W
- 9947 N Yorkshire Ct
- 10507 N 5470 W
- 5423 W Pebble Ln
- 1271 E Desert Peak St
- 1247 E Desert Peak St
- 1793 E Kern Mountain
- McLean Farmhouse Plan at Ridgeview - Cottages
- McLean Farmhouse Plan at Ridgeview - Estates
- 4924 Willowstone Dr
- 703 S 850 W
- 4968 W Evergreen Ln
- 5018 W Northwood Ln
- 10088 N Loblobby Ln
- 10022 N Loblobby Ln Unit 713
- 10089 N Torreya Dr
- 5381 W 10130 N Unit 52
- 10093 N 5300 W
- 10093 N Mystic Cir
- 10077 N Mystic Cir
- 10077 N Mystic Cir
- 5421 W 10130 N
- 5360 W 10130 N
- 5428 W 10080 N
- 10055 N Mystic Cir Unit MY
- 5433 W 10130 N
- 10098 N Mystic Cir
- 5432 W 10130 N
- 10066 N 5300 W
- 5427 W 10080 N
- 10136 N Mystic Dr
- 10039 Mystic Cir
- 5347 W Willem Place
- 5411 W 10180 N
- 5371 W Willem Place
- 5453 W 10130 N