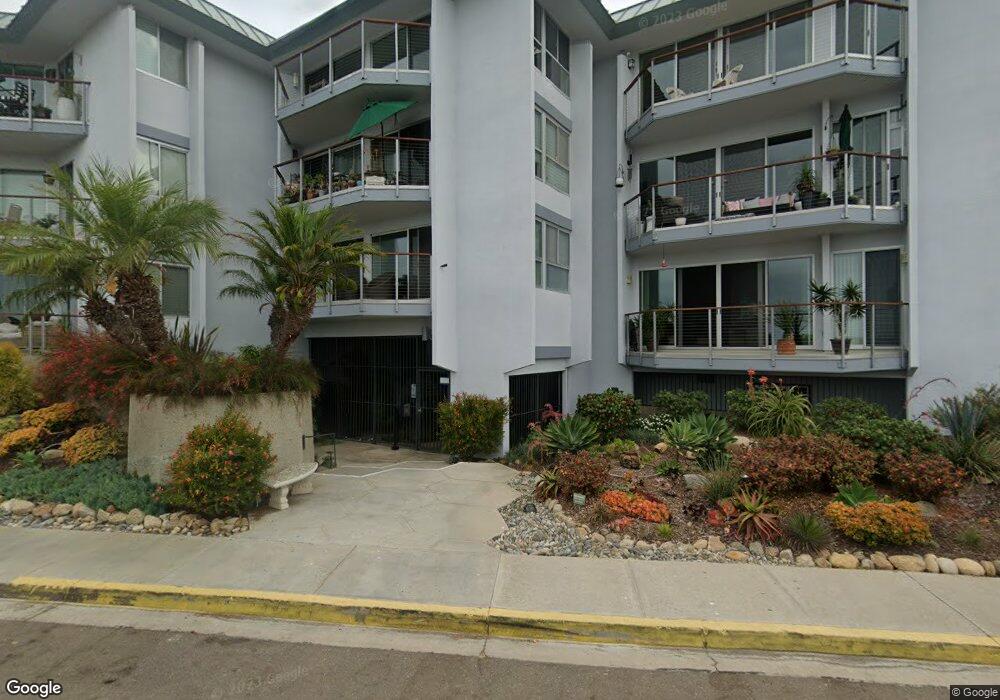
5383 Chelsea St Unit Y La Jolla, CA 92037
Bird Rock NeighborhoodEstimated Value: $1,068,883 - $1,715,000
2
Beds
2
Baths
1,253
Sq Ft
$1,141/Sq Ft
Est. Value
About This Home
This home is located at 5383 Chelsea St Unit Y, La Jolla, CA 92037 and is currently estimated at $1,430,221, approximately $1,141 per square foot. 5383 Chelsea St Unit Y is a home located in San Diego County with nearby schools including Bird Rock Elementary School, Muirlands Middle School, and La Jolla High School.
Ownership History
Date
Name
Owned For
Owner Type
Purchase Details
Closed on
Jul 14, 2004
Sold by
Rosner Robert A
Bought by
Rosner Robert A
Current Estimated Value
Purchase Details
Closed on
Feb 17, 2000
Sold by
Rosner Robert A
Bought by
Rosner Robert A and Rosner Raita
Create a Home Valuation Report for This Property
The Home Valuation Report is an in-depth analysis detailing your home's value as well as a comparison with similar homes in the area
Home Values in the Area
Average Home Value in this Area
Purchase History
| Date | Buyer | Sale Price | Title Company |
|---|---|---|---|
| Rosner Robert A | -- | -- | |
| Rosner Robert A | -- | -- |
Source: Public Records
Tax History Compared to Growth
Tax History
| Year | Tax Paid | Tax Assessment Tax Assessment Total Assessment is a certain percentage of the fair market value that is determined by local assessors to be the total taxable value of land and additions on the property. | Land | Improvement |
|---|---|---|---|---|
| 2025 | $1,311 | $100,429 | $17,982 | $82,447 |
| 2024 | $1,311 | $98,461 | $17,630 | $80,831 |
| 2023 | $1,283 | $96,532 | $17,285 | $79,247 |
| 2022 | $1,252 | $94,641 | $16,947 | $77,694 |
| 2021 | $1,237 | $92,786 | $16,615 | $76,171 |
| 2020 | $1,223 | $91,835 | $16,445 | $75,390 |
| 2019 | $1,203 | $90,035 | $16,123 | $73,912 |
| 2018 | $1,133 | $88,270 | $15,807 | $72,463 |
| 2017 | $1,100 | $86,541 | $15,498 | $71,043 |
| 2016 | $1,083 | $84,845 | $15,195 | $69,650 |
| 2015 | $1,073 | $83,571 | $14,967 | $68,604 |
| 2014 | $1,058 | $81,935 | $14,674 | $67,261 |
Source: Public Records
Map
Nearby Homes
- 315 Colima Ct
- 5341 Linda Way
- 5357 La Jolla Blvd Unit 29
- 5366 Calumet Ave
- 5460 La Jolla Blvd Unit G202
- 5470 La Jolla Blvd Unit H102
- 5490 La Jolla Blvd Unit K205
- 623 Colima St
- 5527 Calumet Ave
- 608 Forward St
- 5641 La Jolla Hermosa Ave
- 5641 Chelsea Ave
- 819 Van Nuys St
- 5664 Abalone Place
- 751-63 Turquoise St Unit 27-30
- 5710 Dolphin Place
- 5716 Dolphin Place
- 5762 Bellevue Ave
- 5416 Candlelight Dr
- 5787 Bellevue Ave
- 5383 Chelsea St
- 5383 Chelsea St Unit 306
- 5383 Chelsea St Unit 305
- 5383 Chelsea St Unit 304
- 5383 Chelsea St Unit 303
- 5383 Chelsea St Unit 302
- 5383 Chelsea St Unit 301
- 5383 Chelsea St Unit 205
- 5383 Chelsea St Unit 204
- 5383 Chelsea St Unit 203
- 5383 Chelsea St Unit 202
- 5383 Chelsea St Unit 201
- 5383 Chelsea St Unit 106
- 5383 Chelsea St Unit 105
- 5383 Chelsea St Unit 104
- 5383 Chelsea St Unit 103
- 5383 Chelsea St Unit 102
- 5383 Chelsea St Unit 101
- 5410 La Jolla Blvd
- 5410 La Jolla Blvd Unit 306A