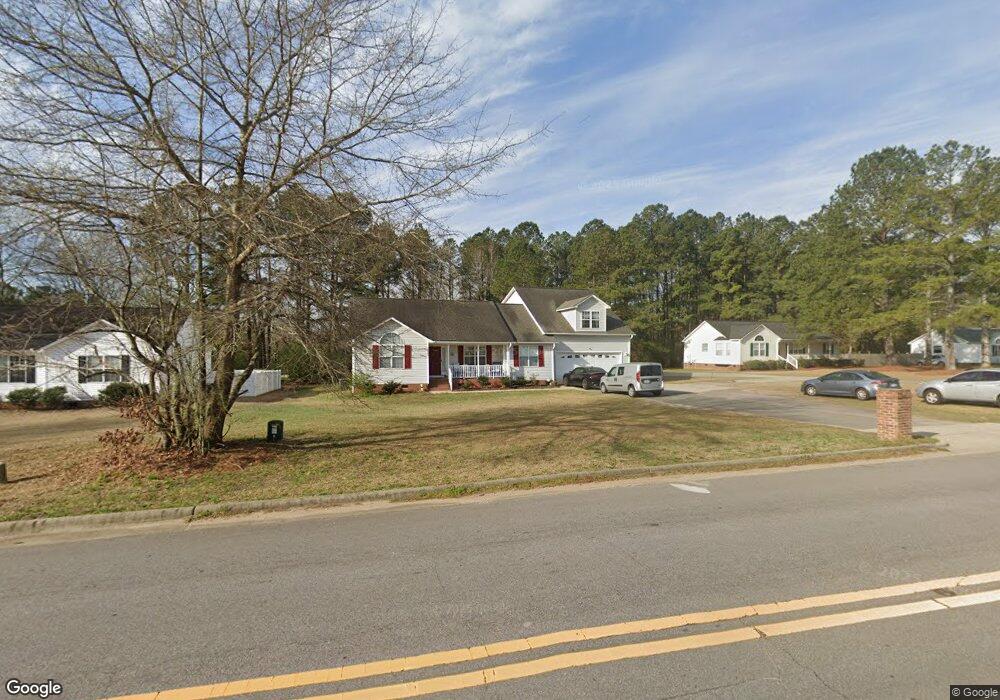
5383 Cleveland Rd Clayton, NC 27520
Cleveland NeighborhoodEstimated Value: $446,000 - $484,000
3
Beds
3
Baths
3,156
Sq Ft
$146/Sq Ft
Est. Value
About This Home
This home is located at 5383 Cleveland Rd, Clayton, NC 27520 and is currently estimated at $461,206, approximately $146 per square foot. 5383 Cleveland Rd is a home located in Johnston County with nearby schools including Polenta Elementary School, Swift Creek Middle, and Cleveland High School.
Ownership History
Date
Name
Owned For
Owner Type
Purchase Details
Closed on
Jun 16, 2021
Sold by
True North Property Owner A Llc
Bought by
True North Property Owner A Llc
Current Estimated Value
Purchase Details
Closed on
Jun 6, 2019
Sold by
Pmc Sfr Holdings Llc
Bought by
Pmc Sfr Borrower Llc
Purchase Details
Closed on
Jun 28, 2016
Sold by
Wilmington Savings Fund Society
Bought by
Pretium Sfr Holding Llc
Purchase Details
Closed on
Jun 16, 2015
Sold by
Rogers Townsend & Thomas Pc
Bought by
Wilmington Saving Fund Society Fsb and Christiana Trust
Purchase Details
Closed on
Dec 28, 2001
Sold by
Stevens Marcus R
Bought by
Son Lan Development Co Inc
Purchase Details
Closed on
Oct 4, 2001
Sold by
Son Lan Development Co Inc
Bought by
Rrl Rental Properties Inc
Purchase Details
Closed on
Mar 8, 2001
Sold by
Rrl Rental Properties Inc
Bought by
Clifton Timmy
Create a Home Valuation Report for This Property
The Home Valuation Report is an in-depth analysis detailing your home's value as well as a comparison with similar homes in the area
Home Values in the Area
Average Home Value in this Area
Purchase History
| Date | Buyer | Sale Price | Title Company |
|---|---|---|---|
| True North Property Owner A Llc | -- | Servicelink | |
| Pmc Sfr Borrower Llc | -- | Os National Llc | |
| Pmc Sfr Borrower Llc | -- | Os National Llc | |
| Pretium Sfr Holding Llc | $224,000 | Servicelink Aliquippa Title | |
| Wilmington Saving Fund Society Fsb | $216,605 | None Available | |
| Son Lan Development Co Inc | $122,000 | -- | |
| Rrl Rental Properties Inc | $25,000 | -- | |
| Clifton Timmy | $25,000 | -- |
Source: Public Records
Tax History Compared to Growth
Tax History
| Year | Tax Paid | Tax Assessment Tax Assessment Total Assessment is a certain percentage of the fair market value that is determined by local assessors to be the total taxable value of land and additions on the property. | Land | Improvement |
|---|---|---|---|---|
| 2025 | $2,718 | $428,060 | $60,630 | $367,430 |
| 2024 | $2,093 | $258,400 | $34,650 | $223,750 |
| 2023 | $2,022 | $258,400 | $34,650 | $223,750 |
| 2022 | $2,125 | $258,400 | $34,650 | $223,750 |
| 2021 | $2,125 | $258,400 | $34,650 | $223,750 |
| 2020 | $2,151 | $258,400 | $34,650 | $223,750 |
| 2019 | $2,151 | $258,400 | $34,650 | $223,750 |
| 2018 | $1,908 | $223,830 | $23,390 | $200,440 |
| 2017 | $1,908 | $223,830 | $23,390 | $200,440 |
| 2016 | $1,908 | $223,830 | $23,390 | $200,440 |
| 2015 | $1,908 | $223,830 | $23,390 | $200,440 |
| 2014 | $1,908 | $223,830 | $23,390 | $200,440 |
Source: Public Records
Map
Nearby Homes
- 72 Polenta Rd
- Wescott Plan at High Springs
- Raleigh Plan at High Springs
- Asheboro Plan at High Springs
- Davidson Plan at High Springs
- Cooper Plan at High Springs
- McDowell Plan at High Springs
- Cypress Plan at High Springs
- Colfax Plan at High Springs
- 79 Quail Point Cir
- 52 Quail Point Cir
- 100 Brodie Rose Landing Way
- 386 Rising Star Dr
- 6603 Cleveland Rd
- 433 Steel Bridge Rd
- 250 Brodie Rose Landing Way
- 55 Black Horse Way
- 26 Union City Ct
- 15 Independence Dr
- 2411 Freedom Rd
- 5341 Cleveland Rd
- 5411 Cleveland Rd
- 10 Polenta Rd
- 8 Polenta Rd
- 51 Polenta Rd
- 6 Polenta Rd
- 4 Polenta Rd
- 76 Polenta Rd
- 95 Polenta Rd
- 5419 Cleveland Rd
- 116 Polenta Rd
- 30 Polenta Rd
- 5299 Cleveland Rd
- 59 Polenta Rd
- 5429 Cleveland Rd
- 21 Polenta Rd
- 79 Polenta Rd Unit 4
- 144 Polenta Rd
- 5273 Cleveland Rd
- 46 Polenta Rd