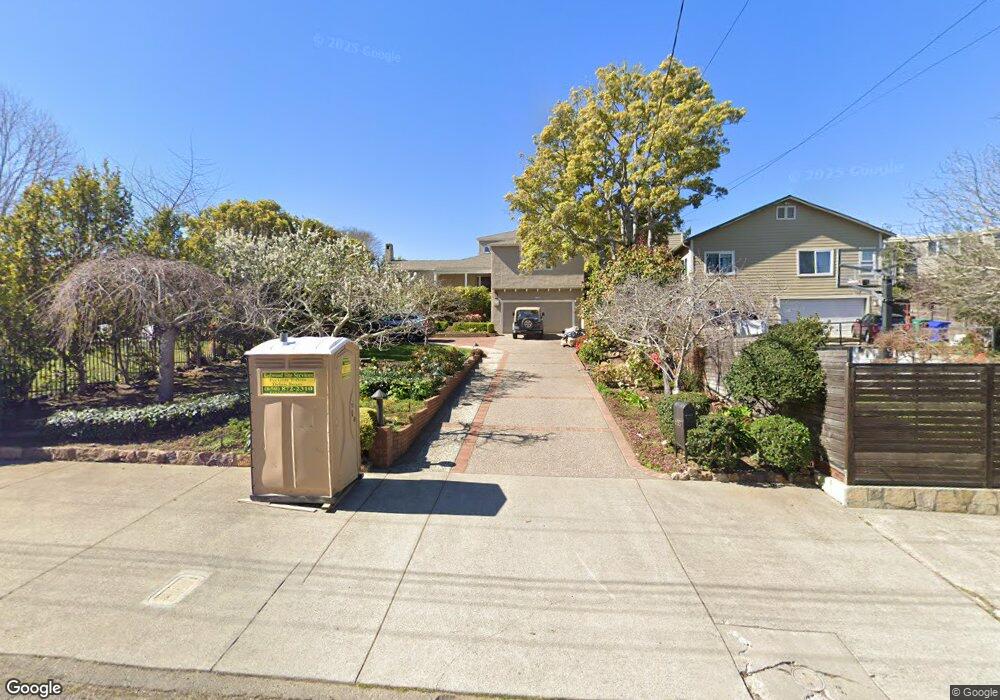
5383 Hilltop Crescent Oakland, CA 94618
Upper Rockridge NeighborhoodEstimated Value: $2,649,000 - $3,707,000
3
Beds
4
Baths
3,105
Sq Ft
$990/Sq Ft
Est. Value
About This Home
This home is located at 5383 Hilltop Crescent, Oakland, CA 94618 and is currently estimated at $3,074,595, approximately $990 per square foot. 5383 Hilltop Crescent is a home located in Alameda County with nearby schools including Hillcrest Elementary School, Skyline High School, and St. Theresa School.
Ownership History
Date
Name
Owned For
Owner Type
Purchase Details
Closed on
Sep 15, 2017
Sold by
Hardtke David and Longphre Malinda
Bought by
Hardtke David Horst and Longphre Malinda
Current Estimated Value
Purchase Details
Closed on
Apr 17, 2015
Sold by
Kuehne Anona E
Bought by
Hardtke David and Longphre Malinda
Home Financials for this Owner
Home Financials are based on the most recent Mortgage that was taken out on this home.
Original Mortgage
$1,620,000
Outstanding Balance
$1,224,498
Interest Rate
3.25%
Mortgage Type
Adjustable Rate Mortgage/ARM
Estimated Equity
$1,850,097
Purchase Details
Closed on
Sep 7, 2010
Sold by
Kuehne Anona E
Bought by
Kuehne Anona E and The Survivors Trust Fbo Anona
Create a Home Valuation Report for This Property
The Home Valuation Report is an in-depth analysis detailing your home's value as well as a comparison with similar homes in the area
Home Values in the Area
Average Home Value in this Area
Purchase History
| Date | Buyer | Sale Price | Title Company |
|---|---|---|---|
| Hardtke David Horst | -- | None Available | |
| Hardtke David | $2,220,000 | Placer Title Company | |
| Kuehne Anona E | -- | None Available | |
| Kuehne Anona E | -- | None Available |
Source: Public Records
Mortgage History
| Date | Status | Borrower | Loan Amount |
|---|---|---|---|
| Open | Hardtke David | $1,620,000 |
Source: Public Records
Tax History
| Year | Tax Paid | Tax Assessment Tax Assessment Total Assessment is a certain percentage of the fair market value that is determined by local assessors to be the total taxable value of land and additions on the property. | Land | Improvement |
|---|---|---|---|---|
| 2025 | $35,114 | $2,661,017 | $800,405 | $1,867,612 |
| 2024 | $35,114 | $2,608,714 | $784,714 | $1,831,000 |
| 2023 | $37,249 | $2,564,432 | $769,329 | $1,795,103 |
| 2022 | $36,524 | $2,507,150 | $754,245 | $1,759,905 |
| 2021 | $35,508 | $2,457,865 | $739,459 | $1,725,406 |
| 2020 | $35,121 | $2,439,601 | $731,880 | $1,707,721 |
| 2019 | $34,171 | $2,391,783 | $717,535 | $1,674,248 |
| 2018 | $33,437 | $2,344,897 | $703,469 | $1,641,428 |
| 2017 | $32,296 | $2,298,920 | $689,676 | $1,609,244 |
| 2016 | $31,581 | $2,253,854 | $676,156 | $1,577,698 |
| 2015 | $2,810 | $124,234 | $49,600 | $74,634 |
| 2014 | $2,505 | $121,800 | $48,628 | $73,172 |
Source: Public Records
Map
Nearby Homes
- 5 Abbott Way
- 5630 Moraga Ave
- 100 Sonia St
- 633 Moraga Ave
- 5430 Proctor Ave
- 19 Monte Ave
- 209 Sheridan Rd
- 165 Bell Ave
- 4951 Proctor Ave
- 15 Mesa Ave
- 97 Clarewood Ln
- 415 Pacific Ave
- 6130 Harbord Dr
- 1101 Mountain Blvd
- 316 Pacific Ave
- 233 Capricorn Ave
- 938 Leo Way
- 6356 Broadway Terrace
- 936 Mountain Blvd
- 1715 Oakland Ave
- 5377 Hilltop Crescent
- 5389 Hilltop Crescent
- 5371 Hilltop Crescent
- 5541 Maxwelton Rd
- 5537 Maxwelton Rd
- 24 Stark Knoll Place
- 198 Maxwelton Rd
- 44 Stark Knoll Place
- 50 Stark Knoll Place
- 5392 Hilltop Crescent
- 5365 Hilltop Crescent
- 5372 Hilltop Crescent
- 5540 Maxwelton Rd
- 190 Maxwelton Rd
- 54 Stark Knoll Place
- 5571 Maxwelton Rd
- 5530 Maxwelton Rd
- 5364 Hilltop Crescent
- 5603 Amy Dr
- 155 Maxwelton Rd
Your Personal Tour Guide
Ask me questions while you tour the home.