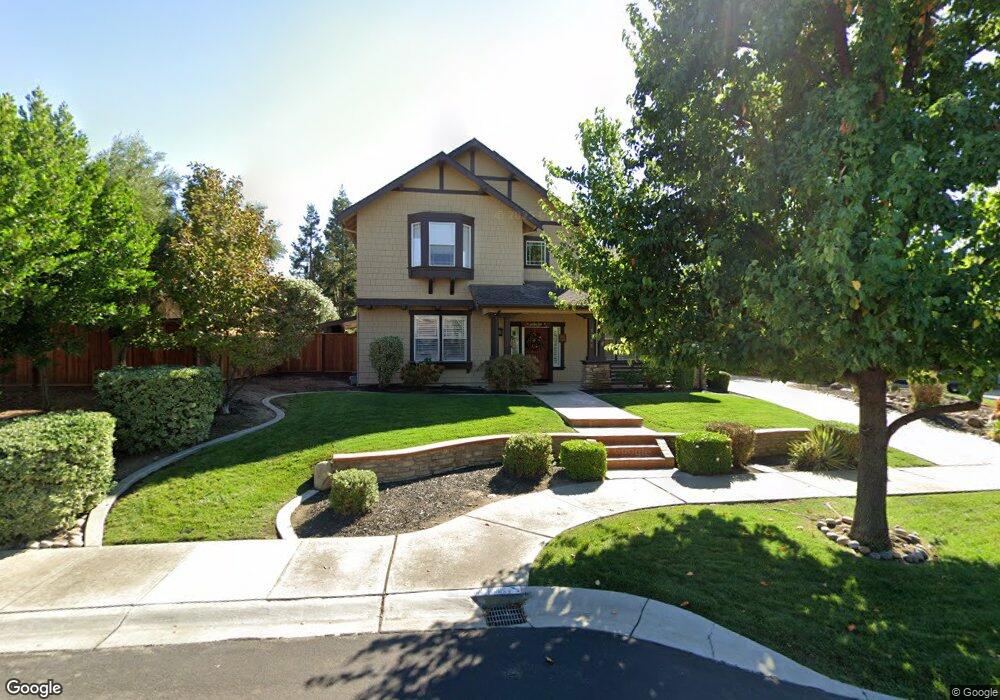
5385 Carnegie Loop Livermore, CA 94550
Dunsmuir NeighborhoodEstimated Value: $1,749,000 - $1,901,369
4
Beds
3
Baths
2,877
Sq Ft
$628/Sq Ft
Est. Value
About This Home
This home is located at 5385 Carnegie Loop, Livermore, CA 94550 and is currently estimated at $1,805,592, approximately $627 per square foot. 5385 Carnegie Loop is a home located in Alameda County with nearby schools including Arroyo Seco Elementary School, East Avenue Middle School, and Livermore High School.
Ownership History
Date
Name
Owned For
Owner Type
Purchase Details
Closed on
Feb 17, 2005
Sold by
Myers Kevin
Bought by
Salhoff Shawn M and Salhoff Teresa M
Current Estimated Value
Home Financials for this Owner
Home Financials are based on the most recent Mortgage that was taken out on this home.
Original Mortgage
$645,000
Outstanding Balance
$223,639
Interest Rate
1%
Mortgage Type
New Conventional
Estimated Equity
$1,581,953
Purchase Details
Closed on
Mar 10, 2004
Sold by
Mamaoag Josephine and Gaba Jumer
Bought by
Myers Kevin
Home Financials for this Owner
Home Financials are based on the most recent Mortgage that was taken out on this home.
Original Mortgage
$587,200
Interest Rate
4.12%
Mortgage Type
Purchase Money Mortgage
Purchase Details
Closed on
Jan 2, 2001
Sold by
Signature Properties Inc
Bought by
Mamaoag Josephine and Gaba Jumer
Home Financials for this Owner
Home Financials are based on the most recent Mortgage that was taken out on this home.
Original Mortgage
$655,875
Interest Rate
7.71%
Mortgage Type
Stand Alone First
Create a Home Valuation Report for This Property
The Home Valuation Report is an in-depth analysis detailing your home's value as well as a comparison with similar homes in the area
Home Values in the Area
Average Home Value in this Area
Purchase History
| Date | Buyer | Sale Price | Title Company |
|---|---|---|---|
| Salhoff Shawn M | $860,000 | Chicago Title Co | |
| Myers Kevin | $734,000 | Chicago Title Company | |
| Mamaoag Josephine | $656,000 | Chicago Title Co |
Source: Public Records
Mortgage History
| Date | Status | Borrower | Loan Amount |
|---|---|---|---|
| Open | Salhoff Shawn M | $645,000 | |
| Previous Owner | Myers Kevin | $587,200 | |
| Previous Owner | Mamaoag Josephine | $655,875 | |
| Closed | Mamaoag Josephine | $65,500 | |
| Closed | Myers Kevin | $73,400 | |
| Closed | Salhoff Shawn M | $129,000 |
Source: Public Records
Tax History
| Year | Tax Paid | Tax Assessment Tax Assessment Total Assessment is a certain percentage of the fair market value that is determined by local assessors to be the total taxable value of land and additions on the property. | Land | Improvement |
|---|---|---|---|---|
| 2025 | $15,908 | $1,256,641 | $359,595 | $904,046 |
| 2024 | $15,908 | $1,231,872 | $352,546 | $886,326 |
| 2023 | $15,680 | $1,214,583 | $345,634 | $868,949 |
| 2022 | $15,443 | $1,183,775 | $338,859 | $851,916 |
| 2021 | $15,160 | $1,160,429 | $332,216 | $835,213 |
| 2020 | $14,719 | $1,155,462 | $328,810 | $826,652 |
| 2019 | $14,878 | $1,132,814 | $322,365 | $810,449 |
| 2018 | $14,534 | $1,110,610 | $316,047 | $794,563 |
| 2017 | $14,096 | $1,088,841 | $309,852 | $778,989 |
| 2016 | $12,523 | $970,000 | $291,000 | $679,000 |
| 2015 | $11,355 | $917,000 | $275,100 | $641,900 |
| 2014 | $10,302 | $820,000 | $246,000 | $574,000 |
Source: Public Records
Map
Nearby Homes
- 5590 Hopps Ln
- 5454 Stockton Loop
- 5564 Stockton Loop
- 5218 Norma Way
- 2410 Robinson Cir
- 2583 Cooper Cir
- 5169 Lillian Ct
- 2785 Decker Ln
- 1042 Dana Cir
- 1635 Embassy Cir
- 1762 Cheryl Dr
- 980 Lucille St
- 907 Hazel St
- 912 Loyola Way
- 780 Terry Ln
- 838 Hazel St
- 5143 Tesla Rd
- 2779 Silverado Ct
- 656 Carla St
- 4115 Freeda Ct
- 5371 Carnegie Loop
- 5403 Carnegie Loop
- 5453 Carnegie Loop
- 5465 Carnegie Loop
- 5431 Carnegie Loop
- 5369 Carnegie Loop
- 5388 Carnegie Loop
- 5376 Carnegie Loop
- 5477 Carnegie Loop
- 5390 Carnegie Loop
- 1942 Carlyle St
- 5410 Carnegie Loop
- 5489 Carnegie Loop
- 5364 Carnegie Loop
- 1874 Marini Ln
- 1896 Keeler St
- 1859 Keeler St
- 5448 Carnegie Loop
- 5462 Carnegie Loop
- 5436 Carnegie Loop
Your Personal Tour Guide
Ask me questions while you tour the home.