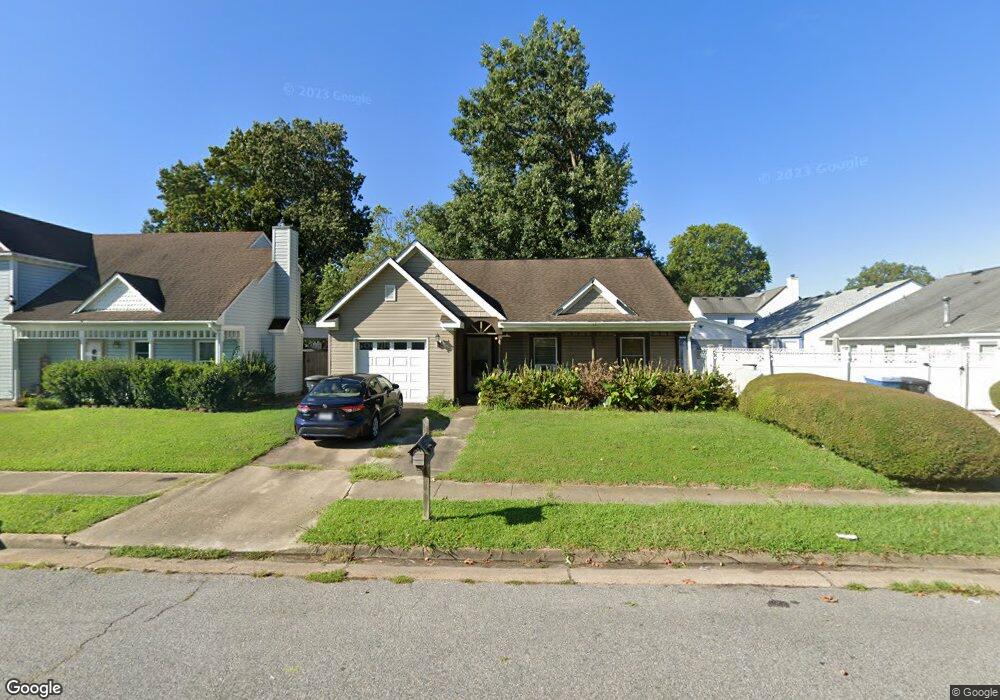
5385 Lynbrook Landing Virginia Beach, VA 23462
Bayside NeighborhoodEstimated Value: $323,000 - $343,000
3
Beds
2
Baths
1,210
Sq Ft
$275/Sq Ft
Est. Value
About This Home
This home is located at 5385 Lynbrook Landing, Virginia Beach, VA 23462 and is currently estimated at $332,824, approximately $275 per square foot. 5385 Lynbrook Landing is a home located in Virginia Beach City with nearby schools including Bettie F. Williams Elementary, Newtown Elementary School, and Diamond Springs Elementary School.
Ownership History
Date
Name
Owned For
Owner Type
Purchase Details
Closed on
Jun 20, 2014
Sold by
Collins Grady W
Bought by
Declute Dennis E
Current Estimated Value
Home Financials for this Owner
Home Financials are based on the most recent Mortgage that was taken out on this home.
Original Mortgage
$160,000
Outstanding Balance
$121,745
Interest Rate
4.21%
Mortgage Type
New Conventional
Estimated Equity
$211,079
Create a Home Valuation Report for This Property
The Home Valuation Report is an in-depth analysis detailing your home's value as well as a comparison with similar homes in the area
Home Values in the Area
Average Home Value in this Area
Purchase History
| Date | Buyer | Sale Price | Title Company |
|---|---|---|---|
| Declute Dennis E | $200,000 | -- |
Source: Public Records
Mortgage History
| Date | Status | Borrower | Loan Amount |
|---|---|---|---|
| Open | Declute Dennis E | $160,000 |
Source: Public Records
Tax History Compared to Growth
Tax History
| Year | Tax Paid | Tax Assessment Tax Assessment Total Assessment is a certain percentage of the fair market value that is determined by local assessors to be the total taxable value of land and additions on the property. | Land | Improvement |
|---|---|---|---|---|
| 2025 | $2,644 | $283,300 | $136,500 | $146,800 |
| 2024 | $2,644 | $272,600 | $130,000 | $142,600 |
| 2023 | $2,428 | $245,300 | $97,000 | $148,300 |
| 2022 | $2,412 | $243,600 | $96,000 | $147,600 |
| 2021 | $2,160 | $218,200 | $80,000 | $138,200 |
| 2020 | $2,145 | $210,800 | $75,000 | $135,800 |
| 2019 | $2,064 | $193,800 | $75,000 | $118,800 |
| 2018 | $1,943 | $193,800 | $75,000 | $118,800 |
| 2017 | $1,804 | $179,900 | $74,000 | $105,900 |
| 2016 | $1,792 | $181,000 | $73,200 | $107,800 |
| 2015 | $1,683 | $170,000 | $69,700 | $100,300 |
| 2014 | $1,497 | $165,700 | $74,900 | $90,800 |
Source: Public Records
Map
Nearby Homes
- 5476 Kiawah Ct
- 703 Oak Hurst Ct
- 5425 Port Royal Dr
- 5020 Titian Ln
- 5441 Lynbrook Landing
- 5289 Pirata Place
- 5240 Pirata Place
- 5228 Pirata Place
- 5348 Garnett Pointe Ct
- 740 Farnham Ln
- 505 Liberty Ct
- 5316 Cottage Ct
- 516 Cape Joshua Ln
- 644 Lawrence Dr
- 716 Aylesbury Dr Unit X1705
- 5512 Lynbrook Landing
- 419 Adkins Arch
- 900 Southmoor Dr Unit 103
- 900 Southmoor Dr Unit 105
- 900 Southmoor Dr Unit 205
- 5381 Lynbrook Landing
- 601 Bridgewater Arch
- 605 Bridgewater Arch
- 5377 Lynbrook Landing
- 633 Bridgewater Arch
- 629 Bridgewater Arch
- 637 Bridgewater Arch
- 625 Bridgewater Arch
- 701 Wagons Way
- 5373 Lynbrook Landing
- 641 Bridgewater Arch
- 705 Wagons Way
- 5369 Lynbrook Landing
- 5390 Lynbrook Landing
- 645 Bridgewater Arch
- 700 Wagons Way
- 604 Bridgewater Arch
- 709 Wagons Way
- 5365 Lynbrook Landing
- 600 Bridgewater Arch