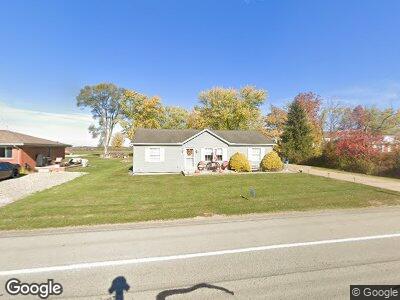
5385 Pleasant Unity Rd Latrobe, PA 15650
Estimated Value: $201,000 - $220,000
--
Bed
--
Bath
1,344
Sq Ft
$156/Sq Ft
Est. Value
About This Home
This home is located at 5385 Pleasant Unity Rd, Latrobe, PA 15650 and is currently estimated at $209,238, approximately $155 per square foot. 5385 Pleasant Unity Rd is a home with nearby schools including Greater Latrobe Junior High School, Greater Latrobe Senior High School, and Christ the Divine Teacher School.
Ownership History
Date
Name
Owned For
Owner Type
Purchase Details
Closed on
Aug 11, 2017
Sold by
Debaise Benjamin A and Debaise Amy M
Bought by
Rsi Home Investors Llc
Current Estimated Value
Purchase Details
Closed on
Apr 3, 2015
Sold by
Debaise Benjamin A and Debaise Amy M
Bought by
Department Of Transportation
Purchase Details
Closed on
May 27, 2011
Sold by
Stone Gregory D
Bought by
Debaise Benjamin A and Debaise Amy M
Home Financials for this Owner
Home Financials are based on the most recent Mortgage that was taken out on this home.
Original Mortgage
$138,400
Interest Rate
4.75%
Mortgage Type
FHA
Purchase Details
Closed on
Jun 30, 2009
Sold by
Curnow Sandra and Curnow John W
Bought by
Stone Gregory D
Purchase Details
Closed on
Oct 19, 2007
Sold by
Woodard Marjorie E and Woodard Evelyn
Bought by
Curnow Sandra
Create a Home Valuation Report for This Property
The Home Valuation Report is an in-depth analysis detailing your home's value as well as a comparison with similar homes in the area
Home Values in the Area
Average Home Value in this Area
Purchase History
| Date | Buyer | Sale Price | Title Company |
|---|---|---|---|
| Rsi Home Investors Llc | $130,000 | None Available | |
| Department Of Transportation | -- | None Available | |
| Debaise Benjamin A | $142,000 | None Available | |
| Stone Gregory D | $23,000 | None Available |
Source: Public Records
Mortgage History
| Date | Status | Borrower | Loan Amount |
|---|---|---|---|
| Open | Rsi Home Investors Llc | $122,000 | |
| Previous Owner | Debaise Benjamin A | $138,400 |
Source: Public Records
Tax History Compared to Growth
Tax History
| Year | Tax Paid | Tax Assessment Tax Assessment Total Assessment is a certain percentage of the fair market value that is determined by local assessors to be the total taxable value of land and additions on the property. | Land | Improvement |
|---|---|---|---|---|
| 2025 | $2,252 | $18,660 | $1,730 | $16,930 |
| 2024 | $2,252 | $18,660 | $1,730 | $16,930 |
| 2023 | $2,065 | $18,660 | $1,730 | $16,930 |
| 2022 | $2,065 | $18,660 | $1,730 | $16,930 |
| 2021 | $2,047 | $18,660 | $1,730 | $16,930 |
| 2020 | $2,014 | $18,660 | $1,730 | $16,930 |
| 2019 | $1,986 | $18,660 | $1,730 | $16,930 |
| 2018 | $1,977 | $18,660 | $1,730 | $16,930 |
| 2017 | $1,926 | $18,660 | $1,730 | $16,930 |
| 2016 | $451 | $18,760 | $1,830 | $16,930 |
| 2015 | $454 | $18,760 | $1,830 | $16,930 |
| 2014 | -- | $18,760 | $1,830 | $16,930 |
Source: Public Records
Map
Nearby Homes
- 22 Pleasant Unity Rd
- 0 Pleasant Unity Rd
- 163 Saint Cecilia Rd
- 0 Route 30
- 108 Glacier Ct
- 215 Sequoia Ct
- 1121 B St
- 1113 B St
- 2115 Trento Ln
- 100 Canyon Ct
- 411 Castle Mountain Ct
- 0 Armel Hollow Rd Unit 1676765
- 135 Charles Houck Rd
- 807 Beatty Village Rd
- 418 Lemmon Rd
- Lot C Bell Memorial Rd
- Lot B Rd
- Lot 22 Spruce St
- 444 Meadow Spring Rd
- 437 Lemmon Rd
- 5385 Pleasant Unity Rd
- 5383 Pleasant Unity Rd
- 5379 Pleasant Unity Rd
- 5389 Pleasant Unity Rd
- 5389 Pleasant Unity Rd
- 5373 Pleasant Unity Rd
- 5384 Pleasant Unity Rd
- 5390 Pleasant Unity Rd
- 5371 Pleasant Unity Rd
- 5367 Pleasant Unity Rd
- 5396 Pleasant Unity Rd
- 265 Pleasant Unity Rd
- 5404 Pleasant Unity Rd
- 5370 Pleasant Unity Rd
- 5354 Rt 981
- 5417 Pleasant Unity Rd
- 5420 Pleasant Unity Rd
- 115 Holiday Ln
- 113 Hawkview Ln
- 5342 Pleasant Unity Rd