5386 E Evans Creek Rd Rogue River, OR 97537
Estimated Value: $600,000 - $664,000
5
Beds
2
Baths
3,540
Sq Ft
$181/Sq Ft
Est. Value
About This Home
This home is located at 5386 E Evans Creek Rd, Rogue River, OR 97537 and is currently estimated at $642,423, approximately $181 per square foot. 5386 E Evans Creek Rd is a home located in Jackson County with nearby schools including Rogue River Elementary School, South Valley Academy, and Rogue River Junior/Senior High School.
Ownership History
Date
Name
Owned For
Owner Type
Purchase Details
Closed on
Mar 10, 2009
Sold by
Galloway Daniel E and Galloway Tina L
Bought by
Galloway Joshua J and Galloway Daniel E
Current Estimated Value
Purchase Details
Closed on
Jun 4, 2007
Sold by
Hood Michael R and Hood Sherri L
Bought by
Galloway Daniel E and Galloway Tina L
Purchase Details
Closed on
Oct 19, 2005
Sold by
Shell Sandra B and Blackwell Dan H
Bought by
Hood Michael R and Hood Sherri L
Home Financials for this Owner
Home Financials are based on the most recent Mortgage that was taken out on this home.
Original Mortgage
$119,900
Interest Rate
5.67%
Mortgage Type
Seller Take Back
Create a Home Valuation Report for This Property
The Home Valuation Report is an in-depth analysis detailing your home's value as well as a comparison with similar homes in the area
Purchase History
| Date | Buyer | Sale Price | Title Company |
|---|---|---|---|
| Galloway Joshua J | -- | None Available | |
| Galloway Daniel E | $195,000 | First American | |
| Hood Michael R | $219,900 | First American |
Source: Public Records
Mortgage History
| Date | Status | Borrower | Loan Amount |
|---|---|---|---|
| Previous Owner | Hood Michael R | $119,900 |
Source: Public Records
Tax History
| Year | Tax Paid | Tax Assessment Tax Assessment Total Assessment is a certain percentage of the fair market value that is determined by local assessors to be the total taxable value of land and additions on the property. | Land | Improvement |
|---|---|---|---|---|
| 2026 | $3,223 | $298,680 | -- | -- |
| 2025 | $2,881 | $289,990 | $125,720 | $164,270 |
| 2024 | $2,881 | $281,550 | $122,050 | $159,500 |
| 2023 | $2,670 | $261,650 | $118,490 | $143,160 |
| 2022 | $2,607 | $261,650 | $118,490 | $143,160 |
| 2021 | $2,529 | $254,030 | $115,040 | $138,990 |
| 2020 | $2,469 | $246,640 | $111,690 | $134,950 |
| 2019 | $2,408 | $232,490 | $105,280 | $127,210 |
| 2018 | $2,347 | $227,300 | $102,220 | $125,080 |
| 2017 | $2,247 | $227,300 | $102,220 | $125,080 |
| 2016 | $2,027 | $192,570 | $96,340 | $96,230 |
| 2015 | $1,965 | $192,570 | $96,340 | $96,230 |
| 2014 | $1,899 | $181,530 | $90,800 | $90,730 |
Source: Public Records
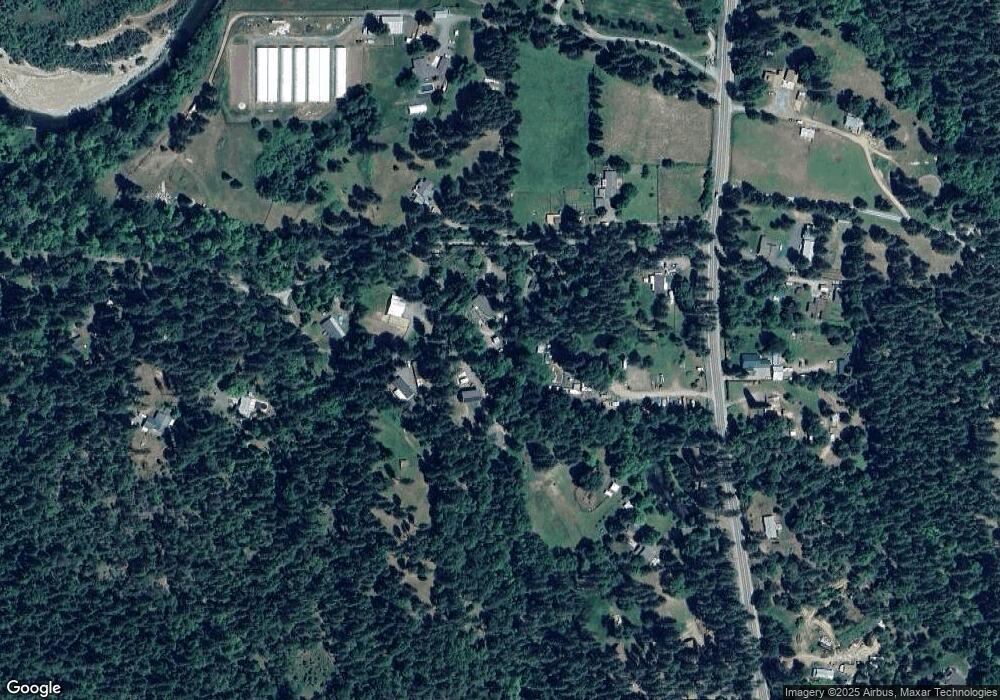
Map
Nearby Homes
- 256 Deruyte Way
- 254 Deruyte Way
- 252 Deruyte Way
- 250 Deruyte Way
- 257 Deruyte Way
- 4697 E Evans Creek Rd
- 255 Deruyte Way
- 253 Deruyte Way
- 251 Deruyte Way
- 249 Deruyte Way
- 6324 E Evans Creek Rd
- 1105 Pine Grove Rd
- 4196 E Evans Creek Rd
- 7118 Redthorne Rd
- 3461 W Evans Creek Rd
- 7310 W Evans Creek Rd
- 2583 E Evans Creek Rd
- 149 Queens Branch Rd
- 2571 E Evans Creek Rd
- 7994 E Evans Creek Rd
- 5355 E Evans Creek Rd
- 5390 E Evans Creek Rd
- 5373 E Evans Creek Rd
- 5388 E Evans Creek Rd
- 5394 E Evans Creek Rd
- 5304 E Evans Creek Rd
- 5211 E Evans Creek Rd
- 5379 E Evans Creek Rd
- 5282 E Evans Creek Rd
- 5364 E Evans Creek Rd
- 5400 E Evans Creek Rd
- 5189 E Evans Creek Rd
- 5204 E Evans Creek Rd
- 5478 E Evans Creek Rd
- 5497 E Evans Creek Rd
- 5085 E Evans Creek Rd
- 5081 E Evans Creek Rd
- 5122 E Evans Creek Rd
- 5602 E Evans Creek Rd
Your Personal Tour Guide
Ask me questions while you tour the home.