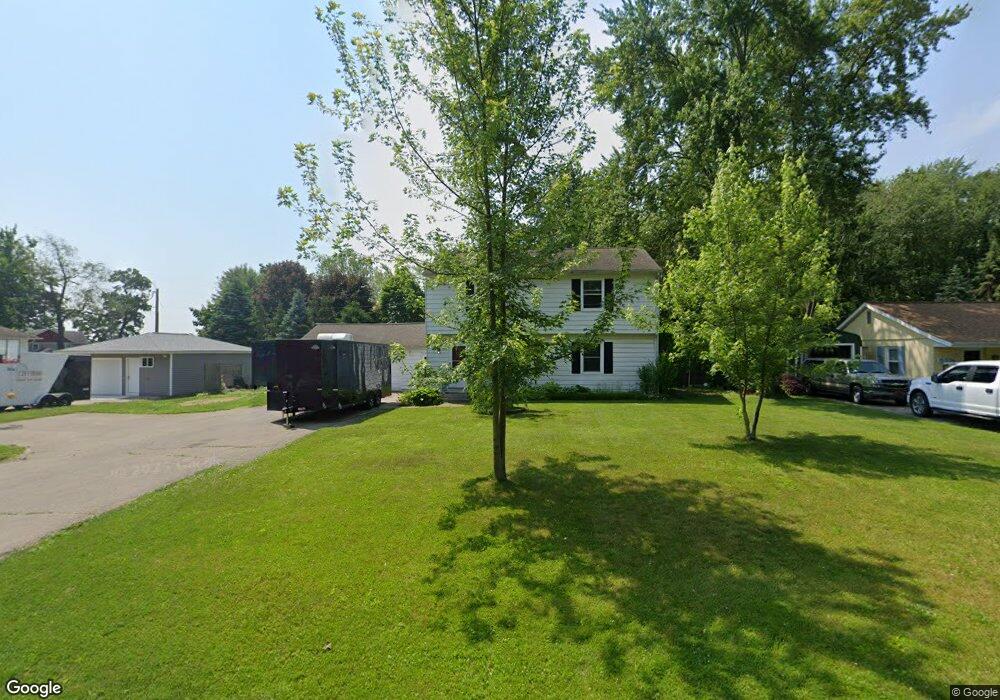
5386 E Q Ave Kalamazoo, MI 49048
Estimated Value: $268,000 - $301,000
4
Beds
2
Baths
2,066
Sq Ft
$137/Sq Ft
Est. Value
About This Home
This home is located at 5386 E Q Ave, Kalamazoo, MI 49048 and is currently estimated at $283,333, approximately $137 per square foot. 5386 E Q Ave is a home located in Kalamazoo County with nearby schools including Lake Center Elementary School, Portage Central Middle School, and Portage Central High School.
Ownership History
Date
Name
Owned For
Owner Type
Purchase Details
Closed on
Oct 18, 2011
Sold by
Fifth Third Bank
Bought by
Schuring Kaylee Alleen and Heystek Douglas Scott
Current Estimated Value
Home Financials for this Owner
Home Financials are based on the most recent Mortgage that was taken out on this home.
Original Mortgage
$81,382
Outstanding Balance
$56,479
Interest Rate
4.62%
Mortgage Type
FHA
Estimated Equity
$226,854
Purchase Details
Closed on
Mar 16, 2011
Sold by
Federal National Mortgage Association
Bought by
Fifth Third Bank
Purchase Details
Closed on
May 20, 2010
Sold by
Hamilton Randy and Hamilton Michael
Bought by
Federal National Mortgage Association
Purchase Details
Closed on
May 30, 2007
Sold by
Dorman Brian E and Dorman Shellie R
Bought by
Hamilton Randy and Hamilton Michael
Home Financials for this Owner
Home Financials are based on the most recent Mortgage that was taken out on this home.
Original Mortgage
$150,000
Interest Rate
6.22%
Mortgage Type
Purchase Money Mortgage
Create a Home Valuation Report for This Property
The Home Valuation Report is an in-depth analysis detailing your home's value as well as a comparison with similar homes in the area
Home Values in the Area
Average Home Value in this Area
Purchase History
| Date | Buyer | Sale Price | Title Company |
|---|---|---|---|
| Schuring Kaylee Alleen | $75,000 | None Available | |
| Fifth Third Bank | -- | First American | |
| Federal National Mortgage Association | $154,166 | None Available | |
| Hamilton Randy | $150,000 | Trans |
Source: Public Records
Mortgage History
| Date | Status | Borrower | Loan Amount |
|---|---|---|---|
| Open | Schuring Kaylee Alleen | $81,382 | |
| Previous Owner | Hamilton Randy | $150,000 |
Source: Public Records
Tax History
| Year | Tax Paid | Tax Assessment Tax Assessment Total Assessment is a certain percentage of the fair market value that is determined by local assessors to be the total taxable value of land and additions on the property. | Land | Improvement |
|---|---|---|---|---|
| 2025 | $768 | $124,000 | $0 | $0 |
| 2024 | $746 | $111,200 | $0 | $0 |
| 2023 | $711 | $94,900 | $0 | $0 |
| 2022 | $2,273 | $89,600 | $0 | $0 |
| 2021 | $2,205 | $83,500 | $0 | $0 |
| 2020 | $2,246 | $74,600 | $0 | $0 |
| 2019 | $2,380 | $72,300 | $0 | $0 |
| 2018 | $2,139 | $72,600 | $0 | $0 |
| 2017 | -- | $72,600 | $0 | $0 |
| 2016 | -- | $70,100 | $0 | $0 |
| 2015 | -- | $68,000 | $0 | $0 |
| 2014 | -- | $61,100 | $0 | $0 |
Source: Public Records
Map
Nearby Homes
- 8198 S 24th St
- 8358 W Long Lake Dr
- 7261 Heartwood Ct
- 5845 Leon Dr
- 4224 Tiffany Ave
- 5937 Thistlewood Ave
- 4207 Lum St
- 6189 Clover Meadows Ave
- 8919 Waruf Ave
- 8929 Waruf Ave
- 6199 Thistlewood Ave
- 6204 Thistlewood Ave
- 9300 S Sprinkle Rd
- 9335 the Woodlands Trail Unit 6
- 3308 E Shore Dr
- 9421 Sassafras Trail Unit 76
- 9624 S Sprinkle Rd
- 6500 S Sprinkle Rd
- 2628 E Shore Dr
- 5595 E S Ave
- 5374 E Q Ave
- 8040 W Long Lake Dr
- 5402 E Q Ave
- 8074 W Long Lake Dr
- 5350 E Q Ave
- 5409 E Q Ave
- 5391 E Q Ave
- 8055 W Long Lake Dr
- 8047 W Long Lake Dr
- 8031 W Long Lake Dr
- 5427 E Q Ave
- 5369 E Q Ave
- 8061 W Long Lake Dr
- 8063 W Long Lake Dr
- 8096 W Long Lake Dr
- 8039 W Long Lake Dr
- 8076 W Long Lake Dr
- 8076 W Long Lake Dr
- 8015 W Long Lake Dr
- 5316 E Q Ave
Your Personal Tour Guide
Ask me questions while you tour the home.