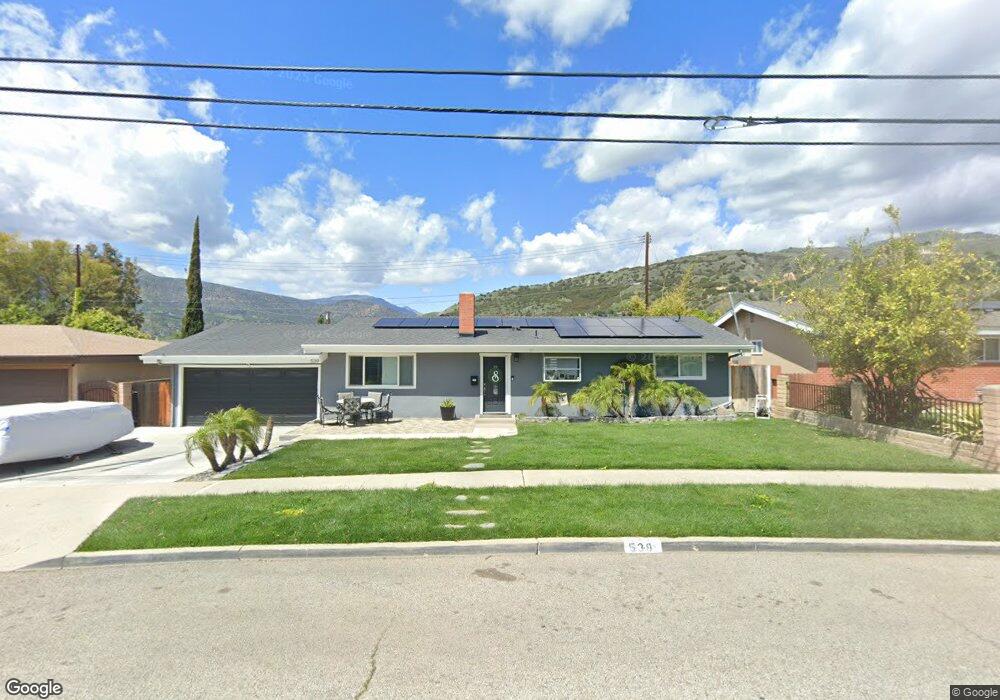
539 3rd St Fillmore, CA 93015
Estimated Value: $640,000 - $716,704
3
Beds
2
Baths
1,363
Sq Ft
$491/Sq Ft
Est. Value
About This Home
This home is located at 539 3rd St, Fillmore, CA 93015 and is currently estimated at $669,176, approximately $490 per square foot. 539 3rd St is a home located in Ventura County with nearby schools including San Cayetano Elementary School and Fillmore Senior High.
Ownership History
Date
Name
Owned For
Owner Type
Purchase Details
Closed on
Jul 25, 2006
Sold by
Scruggs William Harvey and Scruggs Maureen Patricia
Bought by
Sandoval Gerardo and Sandoval Jessica
Current Estimated Value
Home Financials for this Owner
Home Financials are based on the most recent Mortgage that was taken out on this home.
Original Mortgage
$12,500
Outstanding Balance
$7,505
Interest Rate
6.76%
Mortgage Type
Stand Alone Second
Estimated Equity
$661,671
Purchase Details
Closed on
Dec 5, 2001
Sold by
Poling Martin L and Poling Arlene R
Bought by
Scruggs William Harvey and Scruggs Maureen Patricia
Home Financials for this Owner
Home Financials are based on the most recent Mortgage that was taken out on this home.
Original Mortgage
$206,755
Interest Rate
7.17%
Mortgage Type
FHA
Purchase Details
Closed on
Dec 9, 1997
Sold by
Poling Martin L and Poling Arlene R
Bought by
Poling Martin L and Poling Arlene R
Create a Home Valuation Report for This Property
The Home Valuation Report is an in-depth analysis detailing your home's value as well as a comparison with similar homes in the area
Home Values in the Area
Average Home Value in this Area
Purchase History
| Date | Buyer | Sale Price | Title Company |
|---|---|---|---|
| Sandoval Gerardo | $455,000 | Ticor Title Company Of Ca | |
| Scruggs William Harvey | $210,000 | Old Republic Title Company | |
| Poling Martin L | -- | -- |
Source: Public Records
Mortgage History
| Date | Status | Borrower | Loan Amount |
|---|---|---|---|
| Open | Sandoval Gerardo | $12,500 | |
| Open | Sandoval Gerardo | $364,000 | |
| Previous Owner | Scruggs William Harvey | $206,755 |
Source: Public Records
Tax History
| Year | Tax Paid | Tax Assessment Tax Assessment Total Assessment is a certain percentage of the fair market value that is determined by local assessors to be the total taxable value of land and additions on the property. | Land | Improvement |
|---|---|---|---|---|
| 2025 | $6,977 | $669,883 | $515,814 | $154,069 |
| 2024 | $6,977 | $620,000 | $403,000 | $217,000 |
| 2023 | $6,883 | $608,000 | $395,000 | $213,000 |
| 2022 | $6,350 | $595,000 | $387,000 | $208,000 |
| 2021 | $6,304 | $508,000 | $393,000 | $115,000 |
| 2020 | $5,387 | $463,000 | $358,000 | $105,000 |
| 2019 | $5,298 | $445,000 | $344,000 | $101,000 |
| 2018 | $5,140 | $432,000 | $334,000 | $98,000 |
| 2017 | $4,826 | $395,000 | $305,000 | $90,000 |
| 2016 | $4,361 | $378,000 | $292,000 | $86,000 |
| 2015 | $3,721 | $326,000 | $252,000 | $74,000 |
| 2014 | $3,573 | $307,000 | $237,000 | $70,000 |
Source: Public Records
Map
Nearby Homes
- 809 Woodgrove Rd
- 815 Woodgrove Rd
- 345 Blaine Ave
- 639 Mountain View St
- 318 Bard St
- 831 Blaine Ave
- 404 Central Ave
- 340 Central Ave
- 616 Island View St
- 949 Blaine Ave
- 600 C St
- 1106 Mockingbird Ln
- 252 Driftwood St
- 578 Apricot Ln
- 549 Heritage Valley Pkwy
- 513 Heritage Valley Pkwy
- 81 Wildwood Ln
- 458 Edgewood Dr
- 199 Rosewood St
- 313 C St
Your Personal Tour Guide
Ask me questions while you tour the home.