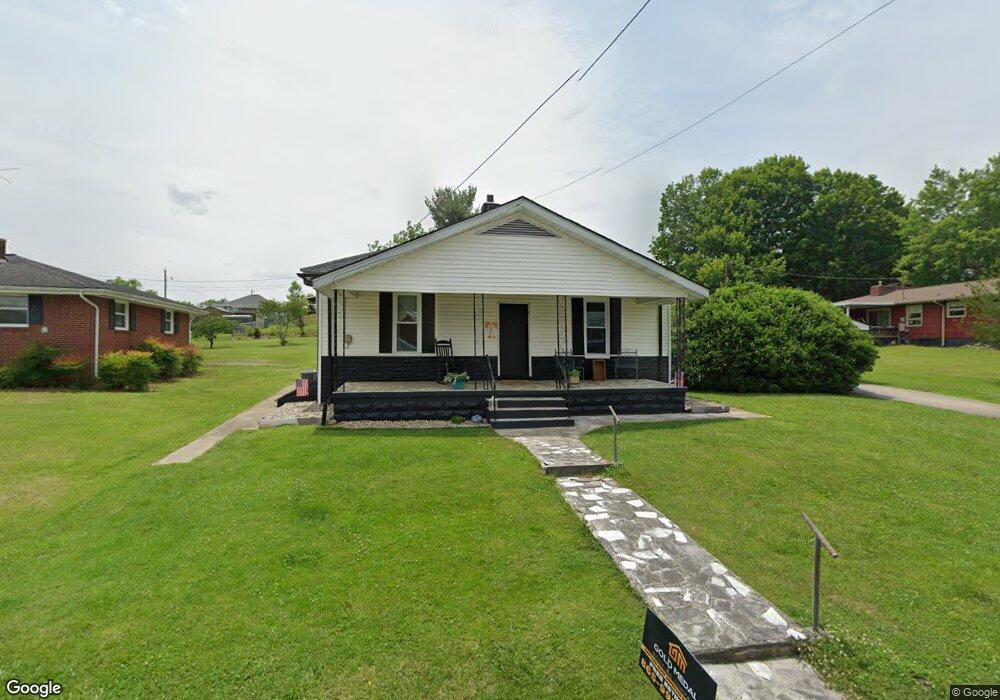
539 3rd St Newport, TN 37821
Estimated Value: $176,000 - $231,000
2
Beds
2
Baths
1,065
Sq Ft
$191/Sq Ft
Est. Value
About This Home
This home is located at 539 3rd St, Newport, TN 37821 and is currently estimated at $203,405, approximately $190 per square foot. 539 3rd St is a home located in Cocke County with nearby schools including Newport Grammar School, Grace Christian School, and Calvary Baptist Tabernacle School.
Ownership History
Date
Name
Owned For
Owner Type
Purchase Details
Closed on
May 16, 2024
Sold by
Thomas Michael
Bought by
Thomas Michael and Thomas Asha
Current Estimated Value
Purchase Details
Closed on
Jan 29, 2016
Sold by
Snader Ray
Bought by
Thomas Michael
Purchase Details
Closed on
Jul 11, 1990
Bought by
Bartlett Henry M
Purchase Details
Closed on
Oct 23, 1989
Bought by
Bush Grooms Betty
Create a Home Valuation Report for This Property
The Home Valuation Report is an in-depth analysis detailing your home's value as well as a comparison with similar homes in the area
Home Values in the Area
Average Home Value in this Area
Purchase History
| Date | Buyer | Sale Price | Title Company |
|---|---|---|---|
| Thomas Michael | -- | None Listed On Document | |
| Thomas Michael | $60,000 | -- | |
| Bartlett Henry M | $41,000 | -- | |
| Bush Grooms Betty | $31,500 | -- |
Source: Public Records
Tax History Compared to Growth
Tax History
| Year | Tax Paid | Tax Assessment Tax Assessment Total Assessment is a certain percentage of the fair market value that is determined by local assessors to be the total taxable value of land and additions on the property. | Land | Improvement |
|---|---|---|---|---|
| 2024 | $1,173 | $23,600 | $6,700 | $16,900 |
| 2023 | $1,173 | $23,600 | $6,700 | $16,900 |
| 2022 | $1,174 | $23,600 | $6,700 | $16,900 |
| 2021 | $1,174 | $23,600 | $6,700 | $16,900 |
| 2020 | $1,174 | $23,600 | $6,700 | $16,900 |
| 2019 | $1,190 | $21,750 | $6,700 | $15,050 |
| 2018 | $1,190 | $21,750 | $6,700 | $15,050 |
| 2017 | $1,259 | $21,750 | $6,700 | $15,050 |
| 2016 | $1,191 | $21,750 | $6,700 | $15,050 |
| 2015 | $933 | $21,750 | $6,700 | $15,050 |
| 2014 | $933 | $21,750 | $6,700 | $15,050 |
| 2013 | $933 | $22,500 | $5,850 | $16,650 |
Source: Public Records
Map
Nearby Homes
- 228 Washington Ave
- 631 6th St
- 286 Belton Ave
- 405 7th St
- 208 Mims Ave
- 582 Cindy jo Rd
- 356 Woodlawn Ave
- 771 Commanche Dr
- 294 Clifton Heights Rd
- 000 Cindy jo Rd
- 240 Clifton Heights Rd
- 338 Jefferson Ave
- 380 Clifton Heights Rd
- 300 Harvest St
- 241 & 245 White Oak Ave
- 525 Freeman Ave
- 560 Rack Ln
- 278 Harvest St
- 640 N Cecil St
- 532 Woodlawn Ave