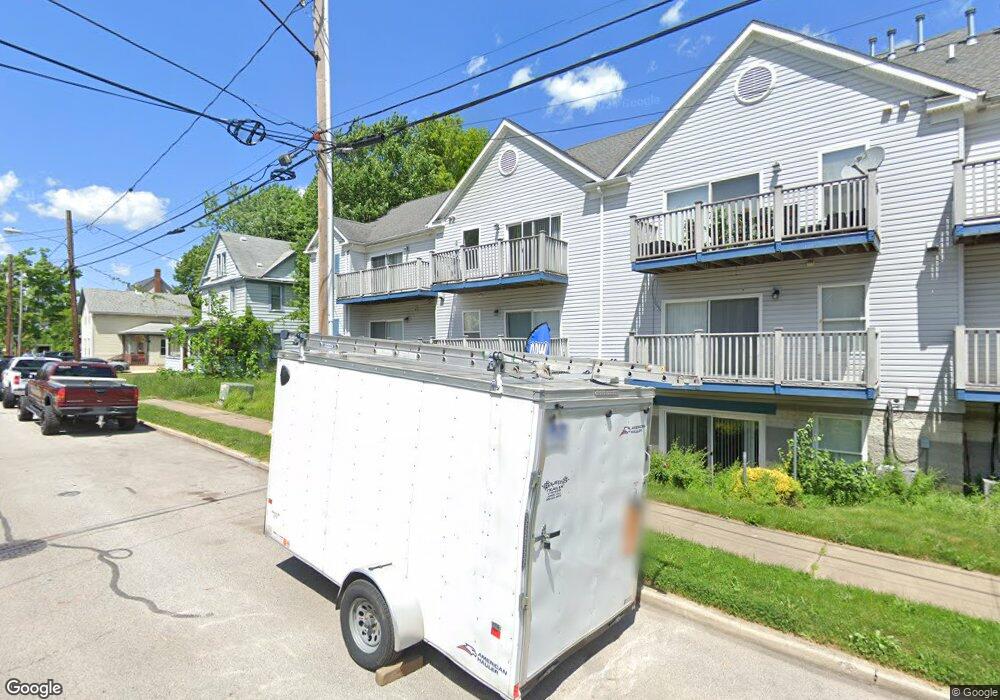
539 Allyn St Akron, OH 44311
Downtown Akron NeighborhoodEstimated Value: $102,000 - $374,224
13
Beds
4
Baths
4,595
Sq Ft
$39/Sq Ft
Est. Value
About This Home
This home is located at 539 Allyn St, Akron, OH 44311 and is currently estimated at $179,806, approximately $39 per square foot. 539 Allyn St is a home located in Summit County with nearby schools including North High School, Main Preparatory Academy, and St. Bernard-St. Mary Elementary School.
Ownership History
Date
Name
Owned For
Owner Type
Purchase Details
Closed on
Sep 23, 2022
Sold by
Dauphin James B
Bought by
Fitzwilliams Real Estate Llc
Current Estimated Value
Home Financials for this Owner
Home Financials are based on the most recent Mortgage that was taken out on this home.
Original Mortgage
$270,000
Outstanding Balance
$257,891
Interest Rate
5.22%
Mortgage Type
New Conventional
Estimated Equity
-$78,085
Create a Home Valuation Report for This Property
The Home Valuation Report is an in-depth analysis detailing your home's value as well as a comparison with similar homes in the area
Home Values in the Area
Average Home Value in this Area
Purchase History
| Date | Buyer | Sale Price | Title Company |
|---|---|---|---|
| Fitzwilliams Real Estate Llc | $360,000 | Right Title |
Source: Public Records
Mortgage History
| Date | Status | Borrower | Loan Amount |
|---|---|---|---|
| Open | Fitzwilliams Real Estate Llc | $270,000 |
Source: Public Records
Tax History
| Year | Tax Paid | Tax Assessment Tax Assessment Total Assessment is a certain percentage of the fair market value that is determined by local assessors to be the total taxable value of land and additions on the property. | Land | Improvement |
|---|---|---|---|---|
| 2024 | $1,490 | $28,358 | $5,653 | $22,705 |
| 2023 | $1,490 | $28,358 | $5,653 | $22,705 |
| 2022 | $1,255 | $18,778 | $3,742 | $15,036 |
| 2021 | $1,257 | $18,778 | $3,742 | $15,036 |
| 2020 | $1,237 | $18,780 | $3,740 | $15,040 |
| 2019 | $933 | $12,860 | $3,320 | $9,540 |
| 2018 | $920 | $12,860 | $3,320 | $9,540 |
| 2017 | $815 | $12,860 | $3,320 | $9,540 |
| 2016 | $815 | $11,200 | $3,320 | $7,880 |
| 2015 | $815 | $11,200 | $3,320 | $7,880 |
| 2014 | $808 | $11,200 | $3,320 | $7,880 |
| 2013 | $866 | $12,270 | $3,320 | $8,950 |
Source: Public Records
Map
Nearby Homes
Your Personal Tour Guide
Ask me questions while you tour the home.