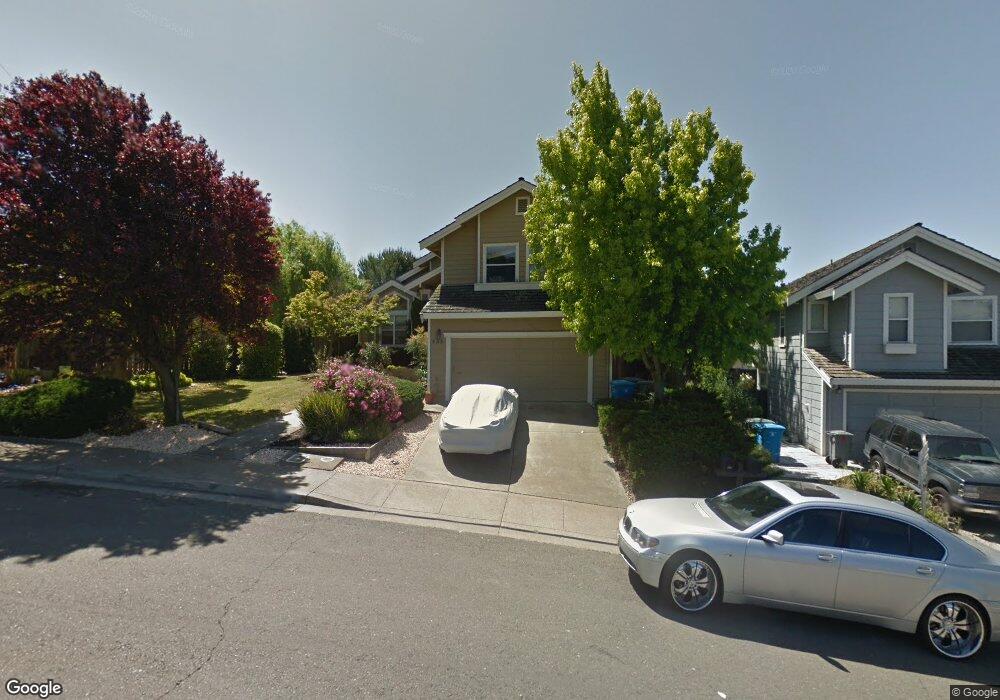
539 Birkdale Dr Vallejo, CA 94591
Estimated Value: $594,000 - $749,000
4
Beds
3
Baths
1,943
Sq Ft
$337/Sq Ft
Est. Value
About This Home
This home is located at 539 Birkdale Dr, Vallejo, CA 94591 and is currently estimated at $655,358, approximately $337 per square foot. 539 Birkdale Dr is a home located in Solano County with nearby schools including Joseph H. Wardlaw Elementary School, Hogan Middle School, and Jesse M. Bethel High School.
Ownership History
Date
Name
Owned For
Owner Type
Purchase Details
Closed on
Oct 5, 2021
Sold by
Williams Katrina C and Williams Frederick L
Bought by
Williams Frederick L and Williams Katrina C
Current Estimated Value
Purchase Details
Closed on
Feb 8, 2005
Sold by
Williams Frederick L
Bought by
Williams Frederick L and Williams Katrina C
Purchase Details
Closed on
Apr 29, 2002
Sold by
Williams Fred L
Bought by
Williams Fred L
Home Financials for this Owner
Home Financials are based on the most recent Mortgage that was taken out on this home.
Original Mortgage
$210,000
Outstanding Balance
$89,921
Interest Rate
7.13%
Estimated Equity
$565,437
Purchase Details
Closed on
Mar 31, 1995
Sold by
Hebert David M and Hebert Tammy L
Bought by
Williams Fred L
Home Financials for this Owner
Home Financials are based on the most recent Mortgage that was taken out on this home.
Original Mortgage
$171,000
Interest Rate
8.81%
Create a Home Valuation Report for This Property
The Home Valuation Report is an in-depth analysis detailing your home's value as well as a comparison with similar homes in the area
Purchase History
| Date | Buyer | Sale Price | Title Company |
|---|---|---|---|
| Williams Frederick L | -- | None Available | |
| Williams Frederick L | -- | -- | |
| Williams Fred L | -- | Fidelity Title | |
| Williams Fred L | $180,000 | First American Title Guarant |
Source: Public Records
Mortgage History
| Date | Status | Borrower | Loan Amount |
|---|---|---|---|
| Open | Williams Fred L | $210,000 | |
| Closed | Williams Fred L | $171,000 |
Source: Public Records
Tax History
| Year | Tax Paid | Tax Assessment Tax Assessment Total Assessment is a certain percentage of the fair market value that is determined by local assessors to be the total taxable value of land and additions on the property. | Land | Improvement |
|---|---|---|---|---|
| 2025 | $4,836 | $302,325 | $100,773 | $201,552 |
| 2024 | $4,836 | $304,537 | $98,798 | $205,739 |
| 2023 | $4,569 | $290,587 | $96,861 | $193,726 |
| 2022 | $4,465 | $284,890 | $94,962 | $189,928 |
| 2021 | $4,366 | $279,304 | $93,100 | $186,204 |
| 2020 | $4,378 | $276,441 | $92,146 | $184,295 |
| 2019 | $4,247 | $271,022 | $90,340 | $180,682 |
| 2018 | $3,991 | $265,709 | $88,569 | $177,140 |
| 2017 | $3,745 | $260,500 | $86,833 | $173,667 |
| 2016 | $3,084 | $255,393 | $85,131 | $170,262 |
| 2015 | $3,025 | $251,558 | $83,853 | $167,705 |
| 2014 | $2,980 | $246,631 | $82,211 | $164,420 |
Source: Public Records
Map
Nearby Homes
- N/A N A
- 118 Lytham Way
- 124 Pierre Ct
- 1290 Rachel Way
- 193 Sunrise Way
- 841 Knights Cir
- 453 Knights Cir
- 155 White Pine Dr
- 124 Gregory Ln
- 401 Avian Dr
- 6067 Loire Ct
- 6206 Pebble Beach Dr
- 367 Darley Dr
- 102 Avian Dr
- 1202 Rollingwood Dr Unit 11A
- 6996 Mortara Ct
- 103 Sandalwood Ct
- 136 Evergreen Way
- 100 Justin Ct
- 1321 Delwood St
- 533 Birkdale Dr
- 160 Royal Ct
- 530 Birkdale Dr
- 525 Birkdale Dr
- 551 Birkdale Dr
- 524 Birkdale Dr
- 517 Birkdale Dr
- 155 Royal Ct
- 556 Birkdale Dr
- 154 Royal Ct
- 557 Birkdale Dr
- 518 Birkdale Dr
- 509 Birkdale Dr
- 562 Birkdale Dr
- 149 Royal Ct
- 563 Birkdale Dr
- 148 Royal Ct
- 512 Birkdale Dr
- 501 Birkdale Dr
- 0 Sky Valley Unit No 3 St Unit 324091112
Your Personal Tour Guide
Ask me questions while you tour the home.