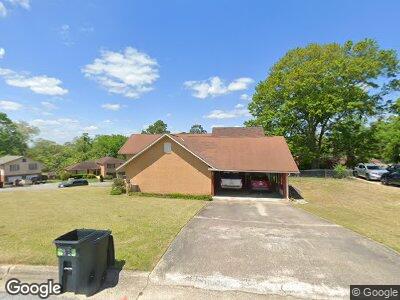
539 Claradon Ave Columbus, GA 31906
Estimated Value: $161,000 - $223,624
4
Beds
4
Baths
2,721
Sq Ft
$73/Sq Ft
Est. Value
About This Home
This home is located at 539 Claradon Ave, Columbus, GA 31906 and is currently estimated at $199,906, approximately $73 per square foot. 539 Claradon Ave is a home located in Muscogee County with nearby schools including Dimon Elementary School, Baker Middle School, and Carver High School.
Ownership History
Date
Name
Owned For
Owner Type
Purchase Details
Closed on
Sep 17, 2024
Sold by
Smith Russell Lee
Bought by
Smith Russell Lee and Smith Darlene
Current Estimated Value
Purchase Details
Closed on
Aug 12, 2011
Sold by
R Spencer Waddell Inc
Bought by
Smith Russell Lee
Home Financials for this Owner
Home Financials are based on the most recent Mortgage that was taken out on this home.
Original Mortgage
$150,658
Interest Rate
3%
Mortgage Type
VA
Purchase Details
Closed on
Jun 30, 2010
Sold by
Edmonds Susie
Bought by
R Spencer Waddell Inc
Create a Home Valuation Report for This Property
The Home Valuation Report is an in-depth analysis detailing your home's value as well as a comparison with similar homes in the area
Home Values in the Area
Average Home Value in this Area
Purchase History
| Date | Buyer | Sale Price | Title Company |
|---|---|---|---|
| Smith Russell Lee | -- | None Listed On Document | |
| Smith Russell Lee | $145,000 | -- | |
| R Spencer Waddell Inc | $190,000 | None Available |
Source: Public Records
Mortgage History
| Date | Status | Borrower | Loan Amount |
|---|---|---|---|
| Previous Owner | Smith Russell Lee | $134,034 | |
| Previous Owner | Smith Russell Lee | $149,123 | |
| Previous Owner | Smith Russell Lee | $149,492 | |
| Previous Owner | Smith Russell Lee | $148,840 | |
| Previous Owner | Smith Russell Lee | $145,794 | |
| Previous Owner | Smith Russell Lee | $150,658 | |
| Previous Owner | Smith Russell Lee | $145,000 | |
| Previous Owner | Edmonds Susie | $112,500 | |
| Previous Owner | Edmondson Susie | $90,000 |
Source: Public Records
Tax History Compared to Growth
Tax History
| Year | Tax Paid | Tax Assessment Tax Assessment Total Assessment is a certain percentage of the fair market value that is determined by local assessors to be the total taxable value of land and additions on the property. | Land | Improvement |
|---|---|---|---|---|
| 2024 | $1,753 | $67,476 | $7,132 | $60,344 |
| 2023 | $11 | $67,476 | $7,132 | $60,344 |
| 2022 | $1,828 | $47,712 | $7,132 | $40,580 |
| 2021 | $1,821 | $52,380 | $7,132 | $45,248 |
| 2020 | $1,822 | $52,380 | $7,132 | $45,248 |
| 2019 | $1,830 | $52,380 | $7,132 | $45,248 |
| 2018 | $1,830 | $52,380 | $7,132 | $45,248 |
| 2017 | $1,837 | $52,380 | $7,132 | $45,248 |
| 2016 | $1,845 | $58,000 | $4,690 | $53,310 |
| 2015 | $1,848 | $58,000 | $4,690 | $53,310 |
| 2014 | $1,851 | $58,000 | $4,690 | $53,310 |
| 2013 | -- | $58,000 | $4,690 | $53,310 |
Source: Public Records
Map
Nearby Homes
- 423 Claradon Ave
- 3507 Matilda Ln
- 3589 Irwin Way
- 3601 Irwin Way
- 3581 Irwin Way
- 3633 Irwin Way
- 758 Terminal Ct
- 770 Terminal Ct
- 776 Terminal Ct
- 3400 Saint Marys Rd Unit LOT 518
- 3400 Saint Marys Rd Unit 450
- 636 Dogwood Dr
- 3414 Terminal St
- 3415 Terminal St
- 809 Dogwood Dr
- 4327 Kenesaw Dr
- 937 Diggs Ave
- 1043 Quincy Dr
- 4228 Debby St
- 4237 Murrelle St
- 539 Claradon Ave
- 545 Claradon Ave
- 550 N Oakley Dr
- 576 N Oakley Dr
- 569 N Oakley Dr
- 551 Claradon Ave
- 565 N Oakley Dr
- 525 Claradon Ave
- 586 N Oakley Dr
- 548 Claradon Ave
- 575 N Oakley Dr
- 581 N Oakley Dr
- 542 N Oakley Dr
- 555 Claradon Ave
- 520 Claradon Ave
- 3738 Steam Mill Rd
- 521 Claradon Ave
- 554 Claradon Ave
- 541 N Oakley Dr
- 3730 Steam Mill Rd