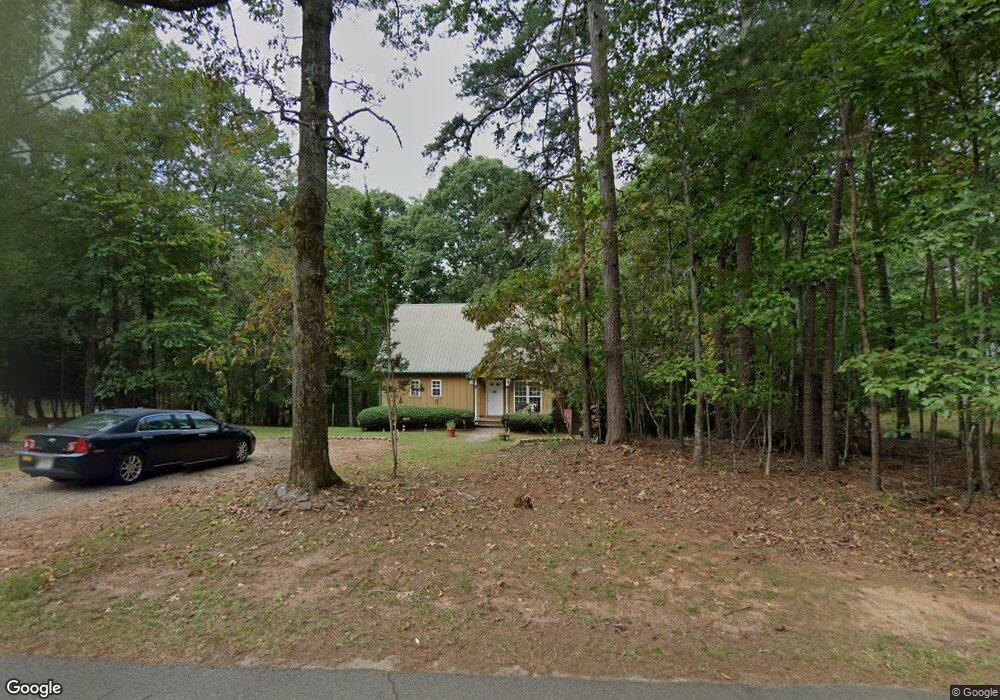
539 Grindle Bridge Rd Dahlonega, GA 30533
Estimated Value: $298,861 - $408,000
--
Bed
2
Baths
1,326
Sq Ft
$257/Sq Ft
Est. Value
About This Home
This home is located at 539 Grindle Bridge Rd, Dahlonega, GA 30533 and is currently estimated at $340,465, approximately $256 per square foot. 539 Grindle Bridge Rd is a home located in Lumpkin County with nearby schools including Clay County Middle School and Lumpkin County High School.
Ownership History
Date
Name
Owned For
Owner Type
Purchase Details
Closed on
Jan 24, 2000
Sold by
Cox Leland
Bought by
Pic Tina Marie
Current Estimated Value
Purchase Details
Closed on
Aug 1, 1998
Sold by
Cox Leland
Bought by
Cox Leland
Purchase Details
Closed on
Apr 13, 1998
Sold by
Welch Jeff
Bought by
Cox Leland
Purchase Details
Closed on
Sep 3, 1996
Bought by
Welch Jeff L
Create a Home Valuation Report for This Property
The Home Valuation Report is an in-depth analysis detailing your home's value as well as a comparison with similar homes in the area
Home Values in the Area
Average Home Value in this Area
Purchase History
| Date | Buyer | Sale Price | Title Company |
|---|---|---|---|
| Pic Tina Marie | $116,500 | -- | |
| Cox Leland | -- | -- | |
| Cox Leland | $14,500 | -- | |
| Welch Jeff L | -- | -- |
Source: Public Records
Tax History Compared to Growth
Tax History
| Year | Tax Paid | Tax Assessment Tax Assessment Total Assessment is a certain percentage of the fair market value that is determined by local assessors to be the total taxable value of land and additions on the property. | Land | Improvement |
|---|---|---|---|---|
| 2024 | $2,340 | $98,915 | $10,600 | $88,315 |
| 2023 | $2,051 | $87,191 | $10,600 | $76,591 |
| 2022 | $1,792 | $72,386 | $10,600 | $61,786 |
| 2021 | $1,577 | $61,598 | $10,600 | $50,998 |
| 2020 | $1,587 | $60,153 | $10,600 | $49,553 |
| 2019 | $1,601 | $60,153 | $10,600 | $49,553 |
| 2018 | $1,532 | $54,006 | $10,600 | $43,406 |
| 2017 | $1,507 | $52,102 | $10,600 | $41,502 |
| 2016 | $1,447 | $48,395 | $10,600 | $37,795 |
| 2015 | $1,288 | $48,395 | $10,600 | $37,795 |
| 2014 | $1,288 | $48,845 | $10,600 | $38,245 |
| 2013 | -- | $49,745 | $10,600 | $39,145 |
Source: Public Records
Map
Nearby Homes
- 64 Highview Ln
- 1063 Grindle Bridge Rd
- 651 Hester Rd
- 45 Chestatee River Ridge
- 349 Hester Rd
- 313 Hester Rd
- 0 Waterfall Dr Unit 9 10472076
- 31 Valhalla Dr
- 55 Santa Pera Dr
- 16 Welch Cir
- 0 Valhalla Dr Unit 10640791
- 242 Hooper Rd
- 3395 Asbury Mill Rd
- 410 Whiskey Still Dr
- 174 Leighs Crossing
- 2927 Asbury Mill Rd
- 120 Brewer Rd
- 0 Horseshoe Bend Rd Unit 10571975
- 0 Horseshoe Bend Rd Unit 7620338
- 380 Copper Mill Rd
- 541 Grindle Bridge Rd
- 537 Grindle Bridge Rd
- 599 Grindle Bridge Rd
- 629 Grindle Bridge Rd Unit 5
- 629 Grindle Bridge Rd
- 629 Grindle Bridge Rd Unit 629
- 232 High Shoals Dr
- 499 Grindle Bridge Rd
- 564 Grindle Bridge Rd
- 254 High Shoals Dr
- 652 Grindle Bridge Rd
- 118 High Shoals Dr
- 691 Grindle Bridge Rd
- 691 Grindle Bridge Rd Unit 7
- 013 River Rock Dr
- 260 Grindle Bridge Rd
- L13 River Rock Dr
- L30 River Rock Dr
- 0 River Rock Dr Unit 5925239
- 0 River Rock Dr Unit 8,9,9A 8277828