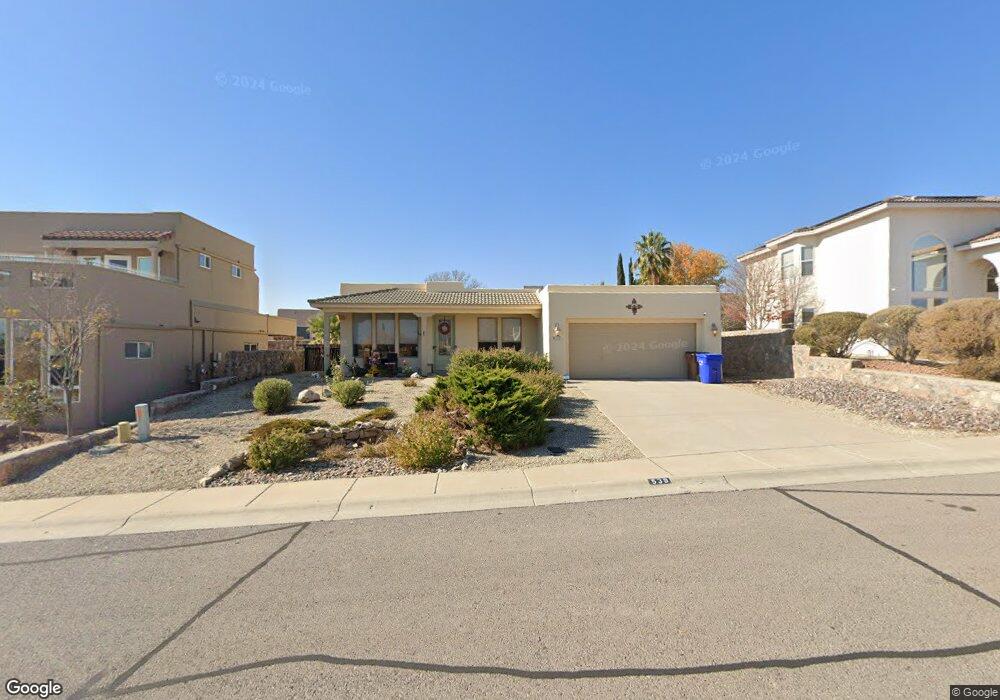
539 La Melodia Dr Las Cruces, NM 88011
Estimated Value: $315,037 - $349,000
3
Beds
2
Baths
1,673
Sq Ft
$198/Sq Ft
Est. Value
About This Home
This home is located at 539 La Melodia Dr, Las Cruces, NM 88011 and is currently estimated at $332,019, approximately $198 per square foot. 539 La Melodia Dr is a home located in Dona Ana County with nearby schools including Desert Hills Elementary School, Camino Real Middle School, and Centennial High School.
Ownership History
Date
Name
Owned For
Owner Type
Purchase Details
Closed on
Dec 13, 2010
Sold by
Marshall Phyllis A
Bought by
Marshall Phyllis A and Phyllis A Marshall Family Trust
Current Estimated Value
Home Financials for this Owner
Home Financials are based on the most recent Mortgage that was taken out on this home.
Original Mortgage
$170,000
Outstanding Balance
$112,316
Interest Rate
4.22%
Mortgage Type
New Conventional
Estimated Equity
$219,703
Purchase Details
Closed on
Aug 1, 2003
Sold by
Schueller Ralph W and Schueller Helen P
Bought by
Dombrowski Edward and Dombrowski Patricia
Home Financials for this Owner
Home Financials are based on the most recent Mortgage that was taken out on this home.
Original Mortgage
$47,600
Interest Rate
5.19%
Mortgage Type
Purchase Money Mortgage
Purchase Details
Closed on
Nov 15, 2002
Sold by
Tate Thomas N and Tate Donna R
Bought by
Schueller Ralph W and Schueller Helen P
Create a Home Valuation Report for This Property
The Home Valuation Report is an in-depth analysis detailing your home's value as well as a comparison with similar homes in the area
Home Values in the Area
Average Home Value in this Area
Purchase History
| Date | Buyer | Sale Price | Title Company |
|---|---|---|---|
| Marshall Phyllis A | -- | Southwestern Abstract & Titl | |
| Marshall Phyllis A | -- | Southwestern Abstract & Titl | |
| Dombrowski Edward | -- | Dona Ana Title Co Inc | |
| Schueller Ralph W | -- | Southwestern Abstract & Titl |
Source: Public Records
Mortgage History
| Date | Status | Borrower | Loan Amount |
|---|---|---|---|
| Open | Marshall Phyllis A | $170,000 | |
| Previous Owner | Dombrowski Edward | $47,600 |
Source: Public Records
Tax History Compared to Growth
Tax History
| Year | Tax Paid | Tax Assessment Tax Assessment Total Assessment is a certain percentage of the fair market value that is determined by local assessors to be the total taxable value of land and additions on the property. | Land | Improvement |
|---|---|---|---|---|
| 2024 | $2,364 | $77,604 | $14,465 | $63,139 |
| 2023 | $2,330 | $75,343 | $14,216 | $61,127 |
| 2022 | $2,294 | $73,149 | $13,974 | $59,175 |
| 2021 | $2,220 | $71,019 | $13,739 | $57,280 |
| 2020 | $2,166 | $68,950 | $13,511 | $55,439 |
| 2019 | $2,109 | $66,943 | $13,290 | $53,653 |
| 2018 | $2,035 | $64,993 | $13,075 | $51,918 |
| 2017 | $1,868 | $64,993 | $13,075 | $51,918 |
| 2016 | $1,838 | $63,100 | $12,867 | $50,233 |
| 2015 | $1,794 | $183,800 | $37,500 | $146,300 |
| 2014 | $1,793 | $183,800 | $37,500 | $146,300 |
Source: Public Records
Map
Nearby Homes
- 535 La Melodia Dr
- 506 Corona Del Campo Loop
- 507 Corona Del Campo Loop
- 4133 Capistrano Ave
- 4309 Capistrano Ave
- 4170 Campana Ct
- 3901 Sonoma Springs Ave Unit 704
- 3901 Sonoma Springs Ave Unit 1008
- 3901 Sonoma Springs Ave Unit 705
- 4051 Bella Sierra Ct
- 4135 Calle Belleza
- 1009 Calle Griega
- 1001 Sonoma Ranch Blvd
- 4123 Bella Sierra Ct
- 2205 Cimarron Dr
- 1695 Boulders Dr
- 4026 La Purisima Dr
- 1721 Stone Mountain Ln
- 1888 El Presidio
- 2131 Sagecrest Ave
- 543 La Melodia Dr
- 517 Corona Del Campo Loop
- 531 La Melodia Dr
- 547 La Melodia Dr
- 536 La Melodia Dr
- 515 Corona Del Campo Loop
- 521 Corona Del Campo Loop
- 527 La Melodia Dr
- 534 La Melodia Dr
- 513 Corona Del Campo Loop
- 526 La Melodia Dr
- 555 La Melodia Dr
- 523 Corona Del Campo Loop
- 559 La Melodia Dr
- 551 La Melodia Dr
- 532 La Melodia Dr
- 563 La Melodia Dr
- 528 La Melodia Dr
- 530 La Melodia Dr
- 523 La Melodia Dr