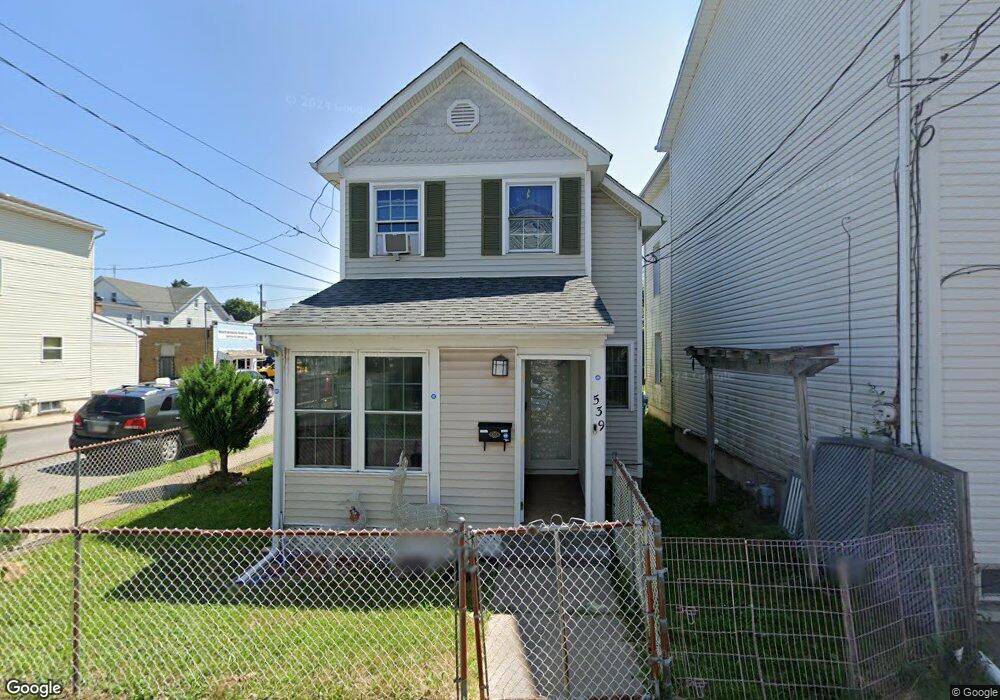
539 Lafayette Ct Hazleton, PA 18201
Estimated Value: $194,484 - $218,000
3
Beds
2
Baths
1,400
Sq Ft
$148/Sq Ft
Est. Value
About This Home
This home is located at 539 Lafayette Ct, Hazleton, PA 18201 and is currently estimated at $207,871, approximately $148 per square foot. 539 Lafayette Ct is a home located in Luzerne County with nearby schools including Hazleton Area High School, Immanuel Christian School, and Holy Family Academy.
Ownership History
Date
Name
Owned For
Owner Type
Purchase Details
Closed on
Jan 14, 2014
Sold by
Federal Home Loan Mortgage Corporation
Bought by
Ramos Belky
Current Estimated Value
Purchase Details
Closed on
May 2, 2013
Sold by
Juan Martin G and Nationstar Mortgage Llc
Bought by
Federal Home Loan Mortgage Corporation
Purchase Details
Closed on
Dec 20, 2006
Sold by
Barnes Joann M
Bought by
Juan Martin G
Home Financials for this Owner
Home Financials are based on the most recent Mortgage that was taken out on this home.
Original Mortgage
$134,000
Interest Rate
7.75%
Mortgage Type
Assumption
Create a Home Valuation Report for This Property
The Home Valuation Report is an in-depth analysis detailing your home's value as well as a comparison with similar homes in the area
Home Values in the Area
Average Home Value in this Area
Purchase History
| Date | Buyer | Sale Price | Title Company |
|---|---|---|---|
| Ramos Belky | $35,000 | None Available | |
| Federal Home Loan Mortgage Corporation | $1,194 | None Available | |
| Juan Martin G | $134,000 | None Available |
Source: Public Records
Mortgage History
| Date | Status | Borrower | Loan Amount |
|---|---|---|---|
| Previous Owner | Juan Martin G | $134,000 |
Source: Public Records
Tax History Compared to Growth
Tax History
| Year | Tax Paid | Tax Assessment Tax Assessment Total Assessment is a certain percentage of the fair market value that is determined by local assessors to be the total taxable value of land and additions on the property. | Land | Improvement |
|---|---|---|---|---|
| 2025 | $1,723 | $60,000 | $26,000 | $34,000 |
| 2024 | $1,615 | $60,000 | $26,000 | $34,000 |
| 2023 | $1,510 | $60,000 | $26,000 | $34,000 |
| 2022 | $1,498 | $60,000 | $26,000 | $34,000 |
| 2021 | $1,464 | $60,000 | $26,000 | $34,000 |
| 2020 | $1,308 | $60,000 | $26,000 | $34,000 |
| 2019 | $1,349 | $60,000 | $26,000 | $34,000 |
| 2018 | $1,304 | $60,000 | $26,000 | $34,000 |
| 2017 | $1,202 | $60,000 | $26,000 | $34,000 |
| 2016 | $854 | $60,000 | $26,000 | $34,000 |
| 2015 | -- | $139,700 | $43,700 | $96,000 |
| 2014 | -- | $139,700 | $43,700 | $96,000 |
Source: Public Records
Map
Nearby Homes
- 1087 N Rear Locust St
- 522 N James St
- 572 N Vine St
- 163 N Church St
- 530 N Lee Ct
- 127 W Diamond Ave
- 714 Alter St
- 523 N Laurel St
- 56 N Laurel St
- 52 N Laurel St
- ER.126 W Aspen St
- 14 W 5th St
- 756 Peace St
- 739 N Church St
- 782 N James St
- 1 W Diamond Ave
- 538 Carson St Unit 40
- 590 Mckinley St
- 738 N Manhattan Ct
- 827 N Vine St