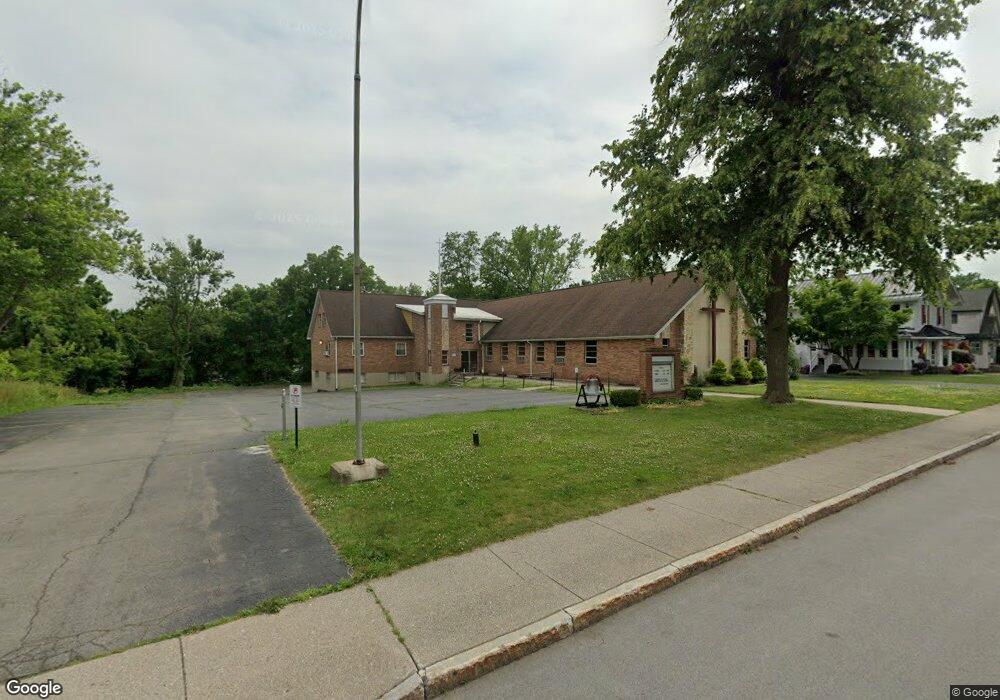
539 Main St West Seneca, NY 14224
Estimated Value: $580,310
Studio
--
Bath
12,320
Sq Ft
$47/Sq Ft
Est. Value
About This Home
This home is located at 539 Main St, West Seneca, NY 14224 and is currently estimated at $580,310, approximately $47 per square foot. 539 Main St is a home located in Erie County with nearby schools including West Elementary School, West Middle School, and West Seneca West Senior High School.
Ownership History
Date
Name
Owned For
Owner Type
Purchase Details
Closed on
Dec 15, 2022
Sold by
Agape United Methodist Church and New Hope United Methodist Church
Bought by
Buffalo Myanmar Mission Church
Current Estimated Value
Home Financials for this Owner
Home Financials are based on the most recent Mortgage that was taken out on this home.
Original Mortgage
$286,650
Outstanding Balance
$276,675
Interest Rate
6.49%
Mortgage Type
Commercial
Estimated Equity
$303,635
Create a Home Valuation Report for This Property
The Home Valuation Report is an in-depth analysis detailing your home's value as well as a comparison with similar homes in the area
Home Values in the Area
Average Home Value in this Area
Purchase History
| Date | Buyer | Sale Price | Title Company |
|---|---|---|---|
| Buffalo Myanmar Mission Church | $441,000 | None Available | |
| Buffalo Myanmar Mission Church | $441,000 | None Available | |
| Buffalo Myanmar Mission Church | $441,000 | None Available | |
| Buffalo Myanmar Mission Church | $441,000 | None Available |
Source: Public Records
Mortgage History
| Date | Status | Borrower | Loan Amount |
|---|---|---|---|
| Open | Buffalo Myanmar Mission Church | $286,650 | |
| Closed | Buffalo Myanmar Mission Church | $286,650 |
Source: Public Records
Tax History
| Year | Tax Paid | Tax Assessment Tax Assessment Total Assessment is a certain percentage of the fair market value that is determined by local assessors to be the total taxable value of land and additions on the property. | Land | Improvement |
|---|---|---|---|---|
| 2024 | $526 | $159,850 | $46,800 | $113,050 |
| 2023 | $336 | $159,850 | $46,800 | $113,050 |
| 2022 | $355 | $159,850 | $46,800 | $113,050 |
| 2021 | $355 | $159,850 | $46,800 | $113,050 |
| 2020 | $386 | $159,850 | $46,800 | $113,050 |
| 2019 | $263 | $159,850 | $46,800 | $113,050 |
| 2018 | $4,910 | $159,850 | $46,800 | $113,050 |
| 2017 | $263 | $159,850 | $46,800 | $113,050 |
| 2016 | $270 | $159,850 | $46,800 | $113,050 |
| 2015 | -- | $159,850 | $46,800 | $113,050 |
| 2014 | -- | $159,850 | $46,800 | $113,050 |
Source: Public Records
Map
Nearby Homes
Your Personal Tour Guide
Ask me questions while you tour the home.