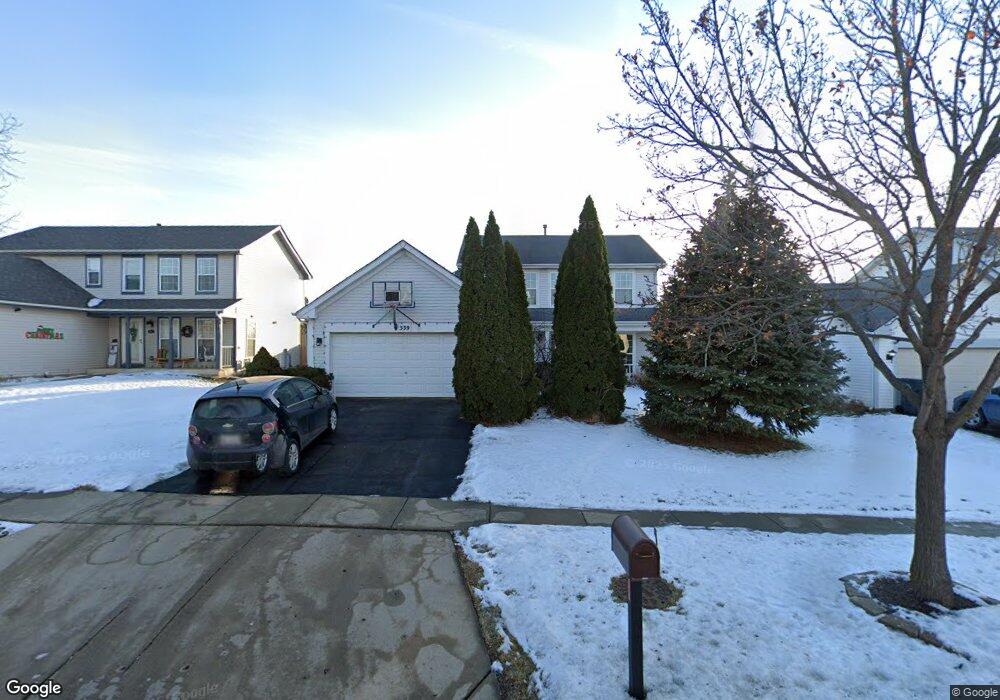
539 Maple Dr Streamwood, IL 60107
Estimated Value: $383,000 - $416,000
3
Beds
3
Baths
1,814
Sq Ft
$221/Sq Ft
Est. Value
About This Home
This home is located at 539 Maple Dr, Streamwood, IL 60107 and is currently estimated at $401,092, approximately $221 per square foot. 539 Maple Dr is a home located in Cook County with nearby schools including Heritage Elementary School, Tefft Middle School, and Streamwood High School.
Ownership History
Date
Name
Owned For
Owner Type
Purchase Details
Closed on
Nov 6, 2017
Sold by
Martinez Andres
Bought by
Molina Nelida
Current Estimated Value
Home Financials for this Owner
Home Financials are based on the most recent Mortgage that was taken out on this home.
Original Mortgage
$125,661
Outstanding Balance
$104,939
Interest Rate
3.99%
Mortgage Type
FHA
Estimated Equity
$296,153
Purchase Details
Closed on
Apr 26, 2001
Sold by
Dino Armina M
Bought by
Martinez Andres
Home Financials for this Owner
Home Financials are based on the most recent Mortgage that was taken out on this home.
Original Mortgage
$157,550
Interest Rate
7.16%
Purchase Details
Closed on
Jan 28, 1998
Sold by
Lakewood Streams Ltd Partnership
Bought by
Dino Arnina M
Home Financials for this Owner
Home Financials are based on the most recent Mortgage that was taken out on this home.
Original Mortgage
$124,481
Interest Rate
10.35%
Create a Home Valuation Report for This Property
The Home Valuation Report is an in-depth analysis detailing your home's value as well as a comparison with similar homes in the area
Home Values in the Area
Average Home Value in this Area
Purchase History
| Date | Buyer | Sale Price | Title Company |
|---|---|---|---|
| Molina Nelida | $130,000 | Premier Title | |
| Martinez Andres | $202,000 | Chicago Title Insurance Co | |
| Dino Arnina M | $166,000 | -- |
Source: Public Records
Mortgage History
| Date | Status | Borrower | Loan Amount |
|---|---|---|---|
| Open | Molina Nelida | $125,661 | |
| Previous Owner | Martinez Andres | $157,550 | |
| Previous Owner | Dino Arnina M | $124,481 |
Source: Public Records
Tax History
| Year | Tax Paid | Tax Assessment Tax Assessment Total Assessment is a certain percentage of the fair market value that is determined by local assessors to be the total taxable value of land and additions on the property. | Land | Improvement |
|---|---|---|---|---|
| 2025 | $8,283 | $37,000 | $6,240 | $30,760 |
| 2024 | $8,283 | $30,000 | $5,460 | $24,540 |
| 2023 | $8,032 | $30,000 | $5,460 | $24,540 |
| 2022 | $8,032 | $30,000 | $5,460 | $24,540 |
| 2021 | $6,630 | $21,401 | $3,705 | $17,696 |
| 2020 | $6,599 | $21,401 | $3,705 | $17,696 |
| 2019 | $6,610 | $24,047 | $3,705 | $20,342 |
| 2018 | $6,756 | $22,561 | $3,315 | $19,246 |
| 2017 | $6,683 | $22,561 | $3,315 | $19,246 |
| 2016 | $6,516 | $22,561 | $3,315 | $19,246 |
| 2015 | $6,826 | $21,818 | $2,925 | $18,893 |
| 2014 | $6,741 | $21,818 | $2,925 | $18,893 |
| 2013 | $6,512 | $21,818 | $2,925 | $18,893 |
Source: Public Records
Map
Nearby Homes
- 413 Lacy Ave
- 128 Sycamore Ave
- 805 Stowell Ave
- 6967 Hemlock St
- 6988 Plumtree Ln
- 1837 Mckool Ave
- 1723 Mckool Ave
- 6881 Hickory St
- 110 N Chase Ave
- 1531 Mckool Ave
- 434 Locksley Dr
- 6835 Plumtree Ln
- 148 Locksley Dr
- 140 N Elroy Ave
- 2110 Cherry Ave
- 103 Locksley Dr
- 733 Oriole Dr
- 195 Mary Ct Unit A
- 194 Robert Ct Unit A
- 1020 S Park Blvd
Your Personal Tour Guide
Ask me questions while you tour the home.