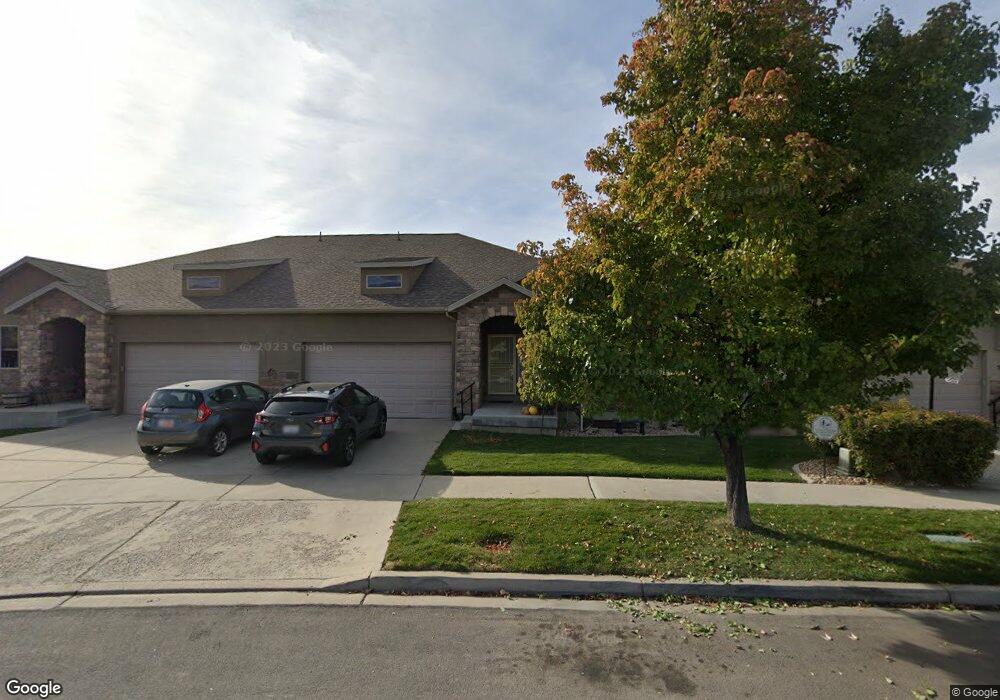
539 N 1110 W Orem, UT 84057
Geneva NeighborhoodEstimated Value: $401,000 - $626,000
5
Beds
3
Baths
3,232
Sq Ft
$165/Sq Ft
Est. Value
About This Home
This home is located at 539 N 1110 W, Orem, UT 84057 and is currently estimated at $532,124, approximately $164 per square foot. 539 N 1110 W is a home located in Utah County with nearby schools including Orem Junior High School, Timpanogos High School, and Franklin Discovery Academy.
Ownership History
Date
Name
Owned For
Owner Type
Purchase Details
Closed on
Mar 28, 2024
Sold by
Watson Andrew M and Watson Ann T
Bought by
Harris Gabrielle
Current Estimated Value
Home Financials for this Owner
Home Financials are based on the most recent Mortgage that was taken out on this home.
Original Mortgage
$448,000
Outstanding Balance
$441,165
Interest Rate
6.77%
Mortgage Type
New Conventional
Estimated Equity
$90,959
Purchase Details
Closed on
Oct 24, 2017
Sold by
Watson Andrew M
Bought by
Watson Andrew M and Watson Ann T
Purchase Details
Closed on
Dec 31, 2014
Sold by
Christofferson Chad
Bought by
Watson Andrew M
Home Financials for this Owner
Home Financials are based on the most recent Mortgage that was taken out on this home.
Original Mortgage
$194,750
Interest Rate
3.96%
Mortgage Type
New Conventional
Purchase Details
Closed on
Jul 2, 2009
Sold by
Hidden Acres Properties Llc
Bought by
Christofferson Chad
Create a Home Valuation Report for This Property
The Home Valuation Report is an in-depth analysis detailing your home's value as well as a comparison with similar homes in the area
Home Values in the Area
Average Home Value in this Area
Purchase History
We collect this data history from publicly available records. To have your information removed, we recommend requesting removal directly through your county’s website.
| Date | Buyer | Sale Price | Title Company |
|---|---|---|---|
| Harris Gabrielle | -- | Metro National Title | |
| Watson Andrew M | -- | None Available | |
| Watson Andrew M | -- | Old Republic Title | |
| Christofferson Chad | -- | Provo Land Title Company |
Source: Public Records
Mortgage History
We collect this data history from publicly available records. To have your information removed, we recommend requesting removal directly through your county’s website.
| Date | Status | Borrower | Loan Amount |
|---|---|---|---|
| Open | Harris Gabrielle | $448,000 | |
| Previous Owner | Watson Andrew M | $194,750 |
Source: Public Records
Tax History
| Year | Tax Paid | Tax Assessment Tax Assessment Total Assessment is a certain percentage of the fair market value that is determined by local assessors to be the total taxable value of land and additions on the property. | Land | Improvement |
|---|---|---|---|---|
| 2025 | $2,345 | $295,130 | -- | -- |
| 2024 | $2,345 | $286,770 | $0 | $0 |
| 2023 | $2,184 | $286,990 | $0 | $0 |
| 2022 | $2,002 | $254,925 | $0 | $0 |
| 2021 | $1,821 | $351,100 | $85,000 | $266,100 |
| 2020 | $1,715 | $325,100 | $85,000 | $240,100 |
| 2019 | $1,497 | $295,000 | $85,000 | $210,000 |
| 2018 | $1,508 | $284,000 | $85,000 | $199,000 |
| 2017 | $1,523 | $153,615 | $0 | $0 |
| 2016 | $1,320 | $122,815 | $0 | $0 |
| 2015 | $1,344 | $118,250 | $0 | $0 |
| 2014 | $1,068 | $93,500 | $0 | $0 |
Source: Public Records
Map
Nearby Homes
- 1123 W 465 N
- 1105 W 420 N
- 418 N 1080 W
- 586 N 940 W
- 954 W 630 N Unit 34,
- 222 N 1200 W Unit 144
- 222 N 1200 W Unit 193
- 222 N 1200 W Unit 53
- 222 N 1200 W Unit 84
- 277 N 1030 W
- 203 N 1200 W Unit 201
- 776 W 640 N
- 557 N Emery Ave
- 108 N 1140 W
- 249 N 800 W
- 1140 W 950 N Unit D302
- 1140 W 950 N Unit D301
- 1140 W 950 N Unit B102
- 1140 W 950 N Unit C303
- 1140 W 950 N Unit C101
Your Personal Tour Guide
Ask me questions while you tour the home.