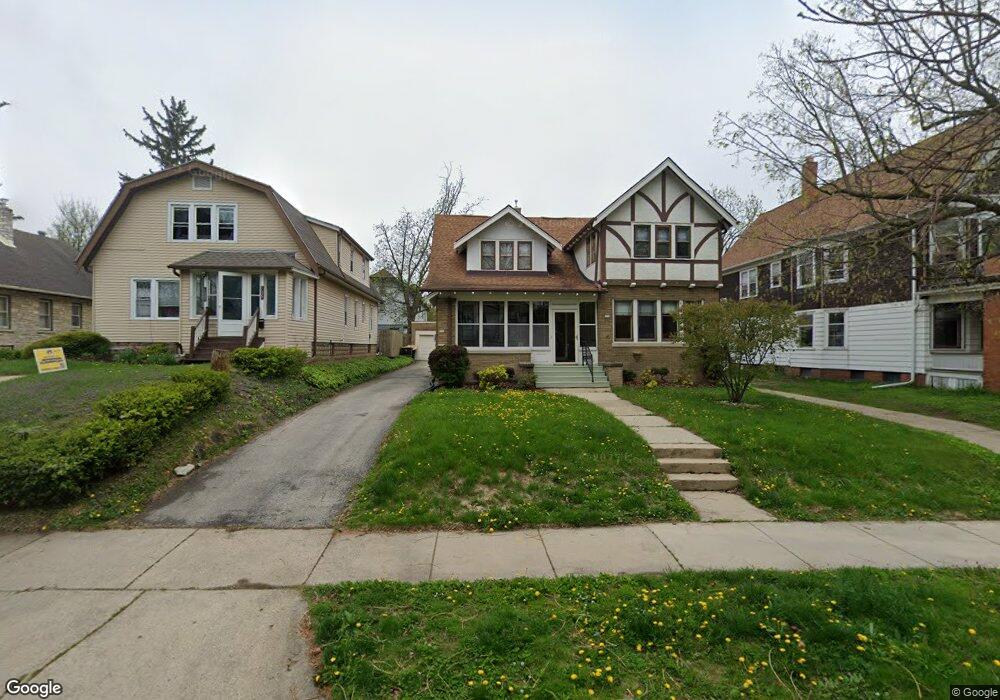
539 N 64th St Milwaukee, WI 53213
Estimated Value: $396,471 - $467,000
4
Beds
2
Baths
2,129
Sq Ft
$203/Sq Ft
Est. Value
About This Home
This home is located at 539 N 64th St, Milwaukee, WI 53213 and is currently estimated at $431,618, approximately $202 per square foot. 539 N 64th St is a home located in Milwaukee County with nearby schools including Jefferson Elementary School, Longfellow Middle School, and East High School.
Ownership History
Date
Name
Owned For
Owner Type
Purchase Details
Closed on
Sep 16, 2004
Sold by
Biebel Mark R and Biebel Jean M
Bought by
Oconnor Lynne and Kick Deborah
Current Estimated Value
Home Financials for this Owner
Home Financials are based on the most recent Mortgage that was taken out on this home.
Original Mortgage
$165,000
Interest Rate
5.89%
Purchase Details
Closed on
Sep 21, 2001
Sold by
Deboer Eric J and Deboer Sandra M
Bought by
Biebel Mark R and Biebel Jean M
Home Financials for this Owner
Home Financials are based on the most recent Mortgage that was taken out on this home.
Original Mortgage
$179,550
Interest Rate
6.69%
Purchase Details
Closed on
Feb 29, 1996
Sold by
Gries Willard W and Gries Dorothy G
Bought by
Deboer Eric J and Cruz Sandra M
Home Financials for this Owner
Home Financials are based on the most recent Mortgage that was taken out on this home.
Original Mortgage
$118,650
Interest Rate
6.75%
Create a Home Valuation Report for This Property
The Home Valuation Report is an in-depth analysis detailing your home's value as well as a comparison with similar homes in the area
Home Values in the Area
Average Home Value in this Area
Purchase History
| Date | Buyer | Sale Price | Title Company |
|---|---|---|---|
| Oconnor Lynne | $235,000 | Evergreen Title Corp | |
| Biebel Mark R | $189,000 | -- | |
| Deboer Eric J | $124,900 | -- |
Source: Public Records
Mortgage History
| Date | Status | Borrower | Loan Amount |
|---|---|---|---|
| Closed | Oconnor Lynne | $165,000 | |
| Previous Owner | Biebel Mark R | $179,550 | |
| Previous Owner | Deboer Eric J | $118,650 |
Source: Public Records
Tax History Compared to Growth
Tax History
| Year | Tax Paid | Tax Assessment Tax Assessment Total Assessment is a certain percentage of the fair market value that is determined by local assessors to be the total taxable value of land and additions on the property. | Land | Improvement |
|---|---|---|---|---|
| 2024 | $4,768 | $222,400 | $85,100 | $137,300 |
| 2023 | $4,476 | $222,400 | $85,100 | $137,300 |
| 2022 | $4,595 | $222,400 | $85,100 | $137,300 |
| 2021 | $4,366 | $222,400 | $85,100 | $137,300 |
| 2020 | $4,689 | $222,400 | $85,100 | $137,300 |
| 2019 | $4,733 | $222,400 | $85,100 | $137,300 |
| 2018 | $5,590 | $220,600 | $81,300 | $139,300 |
| 2017 | $5,060 | $220,600 | $81,300 | $139,300 |
| 2016 | $5,060 | $220,600 | $81,300 | $139,300 |
| 2015 | $5,005 | $220,600 | $81,300 | $139,300 |
| 2014 | $5,013 | $220,600 | $81,300 | $139,300 |
| 2013 | $5,074 | $220,600 | $81,300 | $139,300 |
Source: Public Records
Map
Nearby Homes
- 416 N 64th St
- 528 N 62nd St
- 6105 W Saint Paul Ave
- 530 N 61st St
- 6118 W Wisconsin Ave Unit 20
- 165 N 66th St
- 6042 W Stevenson St
- 403 N 69th St
- 603 N Hawley Rd
- 176 N 69th St
- 6650 Hillside Ln
- 161 S 62nd St
- 7003 W Mount Vernon Ave
- 170 S 64th St
- 209 N 70th St
- 5818 W Valley Forge Dr
- 147 N 70th St
- 603 N 54th St
- 7224 W Bluemound Rd
- 536 N 54th St
- 533 N 64th St
- 532 N 64th St
- 536 N 64th St
- 524 N 64th St
- 544 N 64th St
- 531 N 63rd St Unit 33
- 531 N 63rd St Unit 531 N. 63rd
- 531 N 63rd St Unit 531
- 531 N 63rd St Unit 533
- 535 N 63rd St
- 523 N 63rd St Unit 525
- 541 N 63rd St
- 541 N 63rd St Unit 543
- 556 N 64th St
- 527 N 64th St
- 509 N 64th St Unit 509A
- 519 N 64th St
- 547 N 64th St
- 549 N 63rd St
- 513 N 64th St