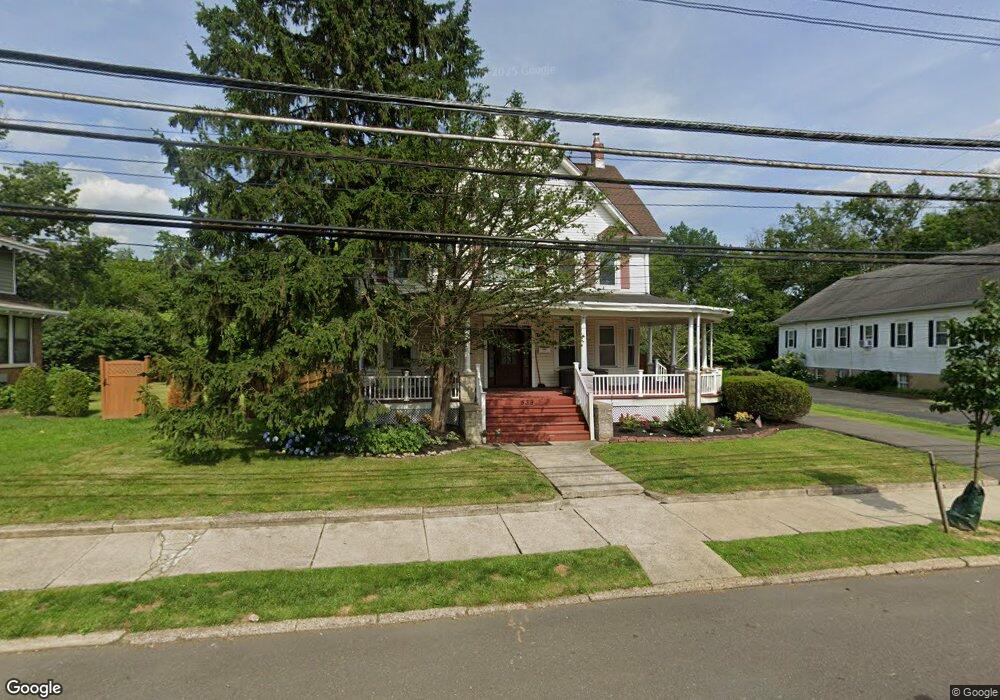
539 N Main St Hightstown, NJ 08520
Estimated Value: $561,413 - $657,000
--
Bed
--
Bath
2,302
Sq Ft
$269/Sq Ft
Est. Value
About This Home
This home is located at 539 N Main St, Hightstown, NJ 08520 and is currently estimated at $619,603, approximately $269 per square foot. 539 N Main St is a home located in Mercer County with nearby schools including Melvin H. Kreps Middle School, Hightstown High School, and SciCore Academy.
Ownership History
Date
Name
Owned For
Owner Type
Purchase Details
Closed on
Dec 29, 1999
Sold by
Meyerberg Lawrence
Bought by
Newman Ronald and Newman Lynn
Current Estimated Value
Home Financials for this Owner
Home Financials are based on the most recent Mortgage that was taken out on this home.
Original Mortgage
$144,000
Outstanding Balance
$45,993
Interest Rate
7.91%
Estimated Equity
$573,610
Purchase Details
Closed on
Jun 19, 1997
Sold by
Bruner Richard
Bought by
Meyerberg Lawrence
Home Financials for this Owner
Home Financials are based on the most recent Mortgage that was taken out on this home.
Original Mortgage
$165,000
Interest Rate
7.86%
Create a Home Valuation Report for This Property
The Home Valuation Report is an in-depth analysis detailing your home's value as well as a comparison with similar homes in the area
Home Values in the Area
Average Home Value in this Area
Purchase History
| Date | Buyer | Sale Price | Title Company |
|---|---|---|---|
| Newman Ronald | $192,000 | -- | |
| Meyerberg Lawrence | $185,000 | -- |
Source: Public Records
Mortgage History
| Date | Status | Borrower | Loan Amount |
|---|---|---|---|
| Open | Newman Ronald | $144,000 | |
| Previous Owner | Meyerberg Lawrence | $165,000 |
Source: Public Records
Tax History Compared to Growth
Tax History
| Year | Tax Paid | Tax Assessment Tax Assessment Total Assessment is a certain percentage of the fair market value that is determined by local assessors to be the total taxable value of land and additions on the property. | Land | Improvement |
|---|---|---|---|---|
| 2025 | $13,375 | $272,800 | $87,100 | $185,700 |
| 2024 | $13,239 | $272,800 | $87,100 | $185,700 |
| 2023 | $13,239 | $272,800 | $87,100 | $185,700 |
| 2022 | $12,781 | $272,800 | $87,100 | $185,700 |
| 2021 | $12,320 | $272,800 | $87,100 | $185,700 |
| 2020 | $12,039 | $272,800 | $87,100 | $185,700 |
| 2019 | $11,703 | $272,800 | $87,100 | $185,700 |
| 2018 | $11,362 | $272,800 | $87,100 | $185,700 |
| 2017 | $11,245 | $272,800 | $87,100 | $185,700 |
| 2016 | $11,147 | $272,800 | $87,100 | $185,700 |
| 2015 | $11,076 | $272,800 | $87,100 | $185,700 |
| 2014 | $11,147 | $272,800 | $87,100 | $185,700 |
Source: Public Records
Map
Nearby Homes
- 5 Mill Run W
- 23 Powell Ct
- 158 Mill Run E
- 164 Mill Run E Unit 141
- 4 Brakeman Ct
- 124 Mill Run E Unit 85
- 126 Mill Run E
- 126 Mill Run E Unit 84
- 23 Barton Dr
- 4 Sandstone Rd
- 128 Monmouth St
- 344 Monmouth St
- 43 Norton Ave
- 15 Brownstone Rd
- 50 -18 Garden View Terrace
- 47 Garden View Terrace Unit 4
- 47 Garden View Terrace
- 11 Braxton Ct
- 309 Lincoln Ave
- 336 Monmouth St