R
Seller's Agent in 2017
Rickie Sipe
Property House, Inc.
Estimated Value: $93,000 - $154,951
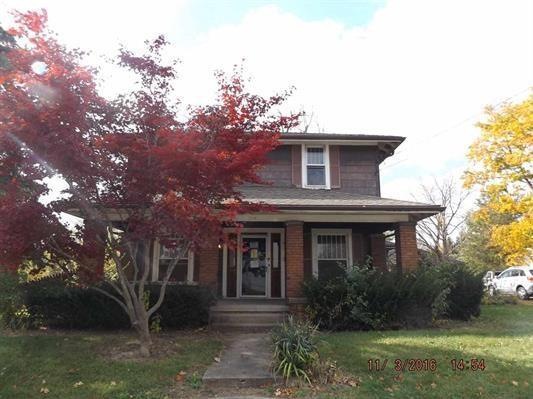
Turn of the century home. Original woodwork. Open staircase with 2 landings and staircases. Large kitchen with a family room area. Fireplace. 2 full baths. 6 bedrooms. Covered front porch. Enclosed sunroom. Deck at the rear. 2 car 2 door detached garage.
Last Agent to Sell the Property
Rickie Sipe
Property House, Inc. Listed on: 11/14/2016
Last Buyer's Agent
Rickie Sipe
Property House, Inc. Listed on: 11/14/2016
| Date | Buyer | Sale Price | Title Company |
|---|---|---|---|
| Pnc Bank N A | -- | None Available |
| Date | Event | Price | List to Sale | Price per Sq Ft | Prior Sale |
|---|---|---|---|---|---|
| 02/16/2017 02/16/17 | Sold | $33,739 | -6.3% | $13 / Sq Ft | |
| 12/15/2016 12/15/16 | Pending | -- | -- | -- | |
| 11/14/2016 11/14/16 | For Sale | $36,000 | +14.3% | $13 / Sq Ft | |
| 03/06/2014 03/06/14 | Sold | $31,500 | -35.1% | $13 / Sq Ft | View Prior Sale |
| 02/03/2014 02/03/14 | Pending | -- | -- | -- | |
| 11/06/2013 11/06/13 | For Sale | $48,500 | -- | $21 / Sq Ft |
| Year | Tax Paid | Tax Assessment Tax Assessment Total Assessment is a certain percentage of the fair market value that is determined by local assessors to be the total taxable value of land and additions on the property. | Land | Improvement |
|---|---|---|---|---|
| 2024 | $974 | $48,700 | $13,100 | $35,600 |
| 2023 | $940 | $47,000 | $13,100 | $33,900 |
| 2022 | $1,494 | $73,000 | $18,000 | $55,000 |
| 2021 | $1,476 | $72,400 | $25,500 | $46,900 |
| 2020 | $1,402 | $68,700 | $24,200 | $44,500 |
| 2019 | $1,378 | $79,600 | $24,200 | $55,400 |
| 2018 | $1,330 | $65,100 | $22,000 | $43,100 |
| 2017 | $1,230 | $91,300 | $19,100 | $72,200 |
| 2016 | $1,792 | $88,200 | $18,200 | $70,000 |
| 2014 | -- | $73,800 | $18,200 | $55,600 |
| 2013 | -- | $71,300 | $18,300 | $53,000 |
R
Seller's Agent in 2017
Rickie Sipe
Property House, Inc.
Source: MIBOR Broker Listing Cooperative®
MLS Number: 21453048
APN: 68-09-20-128-007.000-021
Disclaimer: Certain information contained herein is derived from information provided by parties other than Homes.com. All information provided is deemed reliable, but is not guaranteed to be accurate and should be independently verified.
![]() Based on information submitted to the MLS GRID. All data is obtained from various sources and may not have been verified by broker or MLS GRID. Supplied Open House Information is subject to change without notice. All information should be independently reviewed and verified for accuracy. Properties may or may not be listed by the office/agent presenting the information. Some IDX listings have been excluded from this website.
Based on information submitted to the MLS GRID. All data is obtained from various sources and may not have been verified by broker or MLS GRID. Supplied Open House Information is subject to change without notice. All information should be independently reviewed and verified for accuracy. Properties may or may not be listed by the office/agent presenting the information. Some IDX listings have been excluded from this website.
