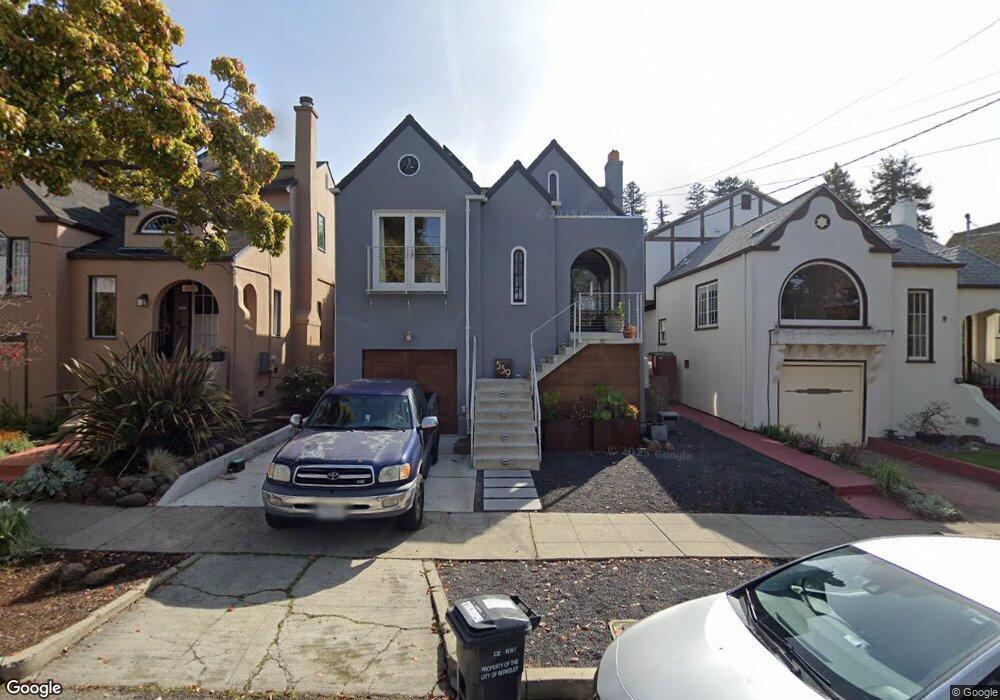
539 Neilson St Berkeley, CA 94707
Thousand Oaks NeighborhoodEstimated Value: $1,436,000 - $2,052,886
4
Beds
3
Baths
2,412
Sq Ft
$724/Sq Ft
Est. Value
About This Home
This home is located at 539 Neilson St, Berkeley, CA 94707 and is currently estimated at $1,745,722, approximately $723 per square foot. 539 Neilson St is a home located in Alameda County with nearby schools including Thousand Oaks Elementary School, Ruth Acty Elementary, and Berkeley Arts Magnet at Whittier School.
Ownership History
Date
Name
Owned For
Owner Type
Purchase Details
Closed on
Nov 12, 2015
Sold by
Miller Howard I and Miller Lisa
Bought by
Lisa Miller & Howard Miller Living Trust
Current Estimated Value
Purchase Details
Closed on
Feb 29, 2000
Sold by
Digiorgiohaag Dirk M and Digiorgiohaag Lisa A
Bought by
Miller Howard I
Home Financials for this Owner
Home Financials are based on the most recent Mortgage that was taken out on this home.
Original Mortgage
$395,250
Interest Rate
8%
Purchase Details
Closed on
Feb 17, 2000
Sold by
Newman Lisa M and Miller Lisa M
Bought by
Miller Howard I
Home Financials for this Owner
Home Financials are based on the most recent Mortgage that was taken out on this home.
Original Mortgage
$395,250
Interest Rate
8%
Create a Home Valuation Report for This Property
The Home Valuation Report is an in-depth analysis detailing your home's value as well as a comparison with similar homes in the area
Home Values in the Area
Average Home Value in this Area
Purchase History
| Date | Buyer | Sale Price | Title Company |
|---|---|---|---|
| Lisa Miller & Howard Miller Living Trust | -- | None Available | |
| Miller Howard I | $527,000 | Placer Title Company | |
| Miller Howard I | -- | Placer Title Company |
Source: Public Records
Mortgage History
| Date | Status | Borrower | Loan Amount |
|---|---|---|---|
| Previous Owner | Miller Howard I | $395,250 |
Source: Public Records
Tax History
| Year | Tax Paid | Tax Assessment Tax Assessment Total Assessment is a certain percentage of the fair market value that is determined by local assessors to be the total taxable value of land and additions on the property. | Land | Improvement |
|---|---|---|---|---|
| 2025 | $16,145 | $1,028,367 | $242,982 | $792,385 |
| 2024 | $16,145 | $1,008,068 | $238,218 | $776,850 |
| 2023 | $15,806 | $995,168 | $233,548 | $761,620 |
| 2022 | $15,513 | $968,658 | $228,969 | $746,689 |
| 2021 | $15,555 | $949,533 | $224,481 | $732,052 |
| 2020 | $14,680 | $946,730 | $222,181 | $724,549 |
| 2019 | $13,572 | $835,253 | $217,825 | $617,428 |
| 2018 | $10,432 | $724,467 | $213,555 | $510,912 |
| 2017 | $10,071 | $710,264 | $209,368 | $500,896 |
| 2016 | $9,777 | $696,341 | $205,264 | $491,077 |
| 2015 | $9,651 | $685,883 | $202,181 | $483,702 |
| 2014 | $9,595 | $672,448 | $198,221 | $474,227 |
Source: Public Records
Map
Nearby Homes
- 415 Berkeley Park Blvd
- 118 Ramona Ave
- 753 Peralta Ave
- 145 Ramona Ave
- 731 Santa fe Ave
- 1266 Washington Ave
- 712 Masonic Ave
- 417 Evelyn Ave Unit 205
- 1236 Portland Ave
- 1983 Yosemite Rd
- 840 Key Route Blvd
- 589 San Luis Rd
- 305 Coronado St
- 483 Boynton Ave
- 443 Albemarle St
- 380 Vermont Ave
- 1498 Sonoma Ave
- 765 San Diego Rd
- 201 Amherst Ave
- 605 San Pablo Ave
Your Personal Tour Guide
Ask me questions while you tour the home.