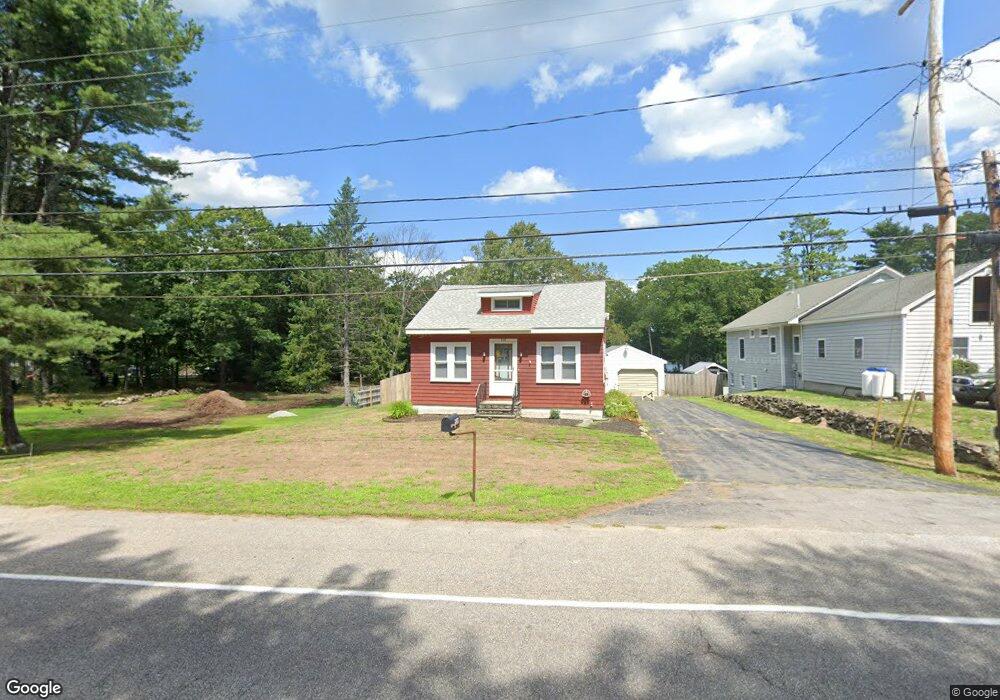
539 Pool St Biddeford, ME 04005
South Biddeford NeighborhoodEstimated Value: $456,315 - $533,000
2
Beds
2
Baths
1,123
Sq Ft
$452/Sq Ft
Est. Value
About This Home
This home is located at 539 Pool St, Biddeford, ME 04005 and is currently estimated at $507,329, approximately $451 per square foot. 539 Pool St is a home located in York County with nearby schools including John F Kennedy Memorial School, Biddeford Primary School, and Biddeford Intermediate School.
Ownership History
Date
Name
Owned For
Owner Type
Purchase Details
Closed on
Jan 19, 2017
Sold by
Martin Helen E
Bought by
Casey Ronald S and Casey Karen P
Current Estimated Value
Home Financials for this Owner
Home Financials are based on the most recent Mortgage that was taken out on this home.
Original Mortgage
$150,000
Outstanding Balance
$122,251
Interest Rate
3.74%
Mortgage Type
Adjustable Rate Mortgage/ARM
Estimated Equity
$385,078
Purchase Details
Closed on
Jul 18, 2005
Sold by
Pyer Juliette Est
Bought by
Martin Helen E and Martin Richard J
Home Financials for this Owner
Home Financials are based on the most recent Mortgage that was taken out on this home.
Original Mortgage
$247,500
Interest Rate
5.67%
Mortgage Type
Purchase Money Mortgage
Create a Home Valuation Report for This Property
The Home Valuation Report is an in-depth analysis detailing your home's value as well as a comparison with similar homes in the area
Home Values in the Area
Average Home Value in this Area
Purchase History
| Date | Buyer | Sale Price | Title Company |
|---|---|---|---|
| Casey Ronald S | -- | -- | |
| Martin Helen E | -- | -- | |
| Martin Helen E | -- | -- |
Source: Public Records
Mortgage History
| Date | Status | Borrower | Loan Amount |
|---|---|---|---|
| Open | Casey Ronald S | $150,000 | |
| Previous Owner | Martin Helen E | $247,500 |
Source: Public Records
Tax History Compared to Growth
Tax History
| Year | Tax Paid | Tax Assessment Tax Assessment Total Assessment is a certain percentage of the fair market value that is determined by local assessors to be the total taxable value of land and additions on the property. | Land | Improvement |
|---|---|---|---|---|
| 2024 | $5,419 | $381,100 | $260,000 | $121,100 |
| 2023 | $4,963 | $378,300 | $257,200 | $121,100 |
| 2022 | $5,763 | $351,200 | $228,000 | $123,200 |
| 2021 | $5,480 | $300,600 | $197,700 | $102,900 |
| 2020 | $5,464 | $272,500 | $176,600 | $95,900 |
| 2019 | $5,445 | $272,500 | $176,600 | $95,900 |
| 2018 | $1,900 | $272,500 | $176,600 | $95,900 |
| 2017 | $3,110 | $266,400 | $176,600 | $89,800 |
| 2016 | $5,291 | $266,400 | $176,600 | $89,800 |
| 2015 | $5,187 | $266,400 | $176,600 | $89,800 |
| 2014 | $5,059 | $266,400 | $176,600 | $89,800 |
| 2013 | -- | $298,000 | $203,300 | $94,700 |
Source: Public Records
Map
Nearby Homes