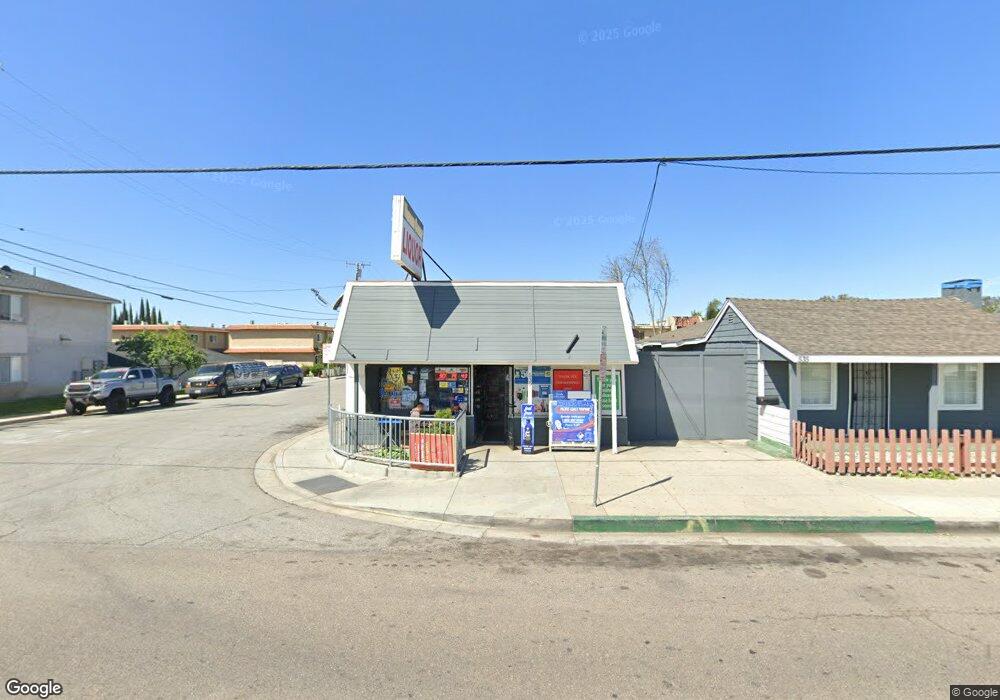
539 S Euclid St La Habra, CA 90631
Estimated Value: $1,038,068
2
Beds
2
Baths
970
Sq Ft
$1,070/Sq Ft
Est. Value
About This Home
This home is located at 539 S Euclid St, La Habra, CA 90631 and is currently estimated at $1,038,068, approximately $1,070 per square foot. 539 S Euclid St is a home located in Orange County with nearby schools including Las Lomas Elementary School, Imperial Middle School, and La Habra High School.
Ownership History
Date
Name
Owned For
Owner Type
Purchase Details
Closed on
Nov 16, 2021
Sold by
Shin Kyung O
Bought by
Shin Chester
Current Estimated Value
Purchase Details
Closed on
Jan 28, 2004
Sold by
Shin Brian Young
Bought by
Shin Kyung O
Home Financials for this Owner
Home Financials are based on the most recent Mortgage that was taken out on this home.
Original Mortgage
$253,500
Interest Rate
5.79%
Mortgage Type
Commercial
Purchase Details
Closed on
Jan 9, 2004
Sold by
Pak Wan Sik and Pak Hong Ae
Bought by
Shin Kyung O
Home Financials for this Owner
Home Financials are based on the most recent Mortgage that was taken out on this home.
Original Mortgage
$253,500
Interest Rate
5.79%
Mortgage Type
Commercial
Purchase Details
Closed on
Dec 10, 2002
Sold by
Pak Hyun Il
Bought by
Pak Wan Sik and Pak Hong Ae
Create a Home Valuation Report for This Property
The Home Valuation Report is an in-depth analysis detailing your home's value as well as a comparison with similar homes in the area
Home Values in the Area
Average Home Value in this Area
Purchase History
| Date | Buyer | Sale Price | Title Company |
|---|---|---|---|
| Shin Chester | -- | Provident Title | |
| Shin Chester | -- | Provident Title | |
| Shin Kyung O | -- | Stewart Title Company | |
| Shin Kyung O | $390,000 | Stewart Title Company | |
| Pak Wan Sik | -- | -- |
Source: Public Records
Mortgage History
| Date | Status | Borrower | Loan Amount |
|---|---|---|---|
| Previous Owner | Shin Kyung O | $253,500 |
Source: Public Records
Tax History Compared to Growth
Tax History
| Year | Tax Paid | Tax Assessment Tax Assessment Total Assessment is a certain percentage of the fair market value that is determined by local assessors to be the total taxable value of land and additions on the property. | Land | Improvement |
|---|---|---|---|---|
| 2025 | $6,590 | $554,492 | $499,761 | $54,731 |
| 2024 | $6,590 | $543,620 | $489,962 | $53,658 |
| 2023 | $6,436 | $532,961 | $480,355 | $52,606 |
| 2022 | $6,366 | $522,511 | $470,936 | $51,575 |
| 2021 | $6,264 | $512,266 | $461,702 | $50,564 |
| 2020 | $6,204 | $507,014 | $456,968 | $50,046 |
| 2019 | $6,038 | $497,073 | $448,008 | $49,065 |
| 2018 | $5,938 | $487,327 | $439,224 | $48,103 |
| 2017 | $5,834 | $477,772 | $430,612 | $47,160 |
| 2016 | $5,698 | $468,404 | $422,168 | $46,236 |
| 2015 | $5,538 | $461,369 | $415,827 | $45,542 |
| 2014 | $5,377 | $452,332 | $407,682 | $44,650 |
Source: Public Records
Map
Nearby Homes
- 601 S Euclid St Unit 4
- 211 W Mountain View Ave
- 208 W Olive Ave Unit B
- 405 W Mountain View Ave
- 405 W Mountain View Ave Unit 13
- 303 S Cadiz Ct
- 418 W Olive Ave
- 414 W Olive Ave
- 621 S Olive Ave
- 313 W 1st Ave Unit M
- 1001 W Lambert Rd Unit 127
- 1001 W Lambert Rd Unit 116
- 1001 W Lambert Rd Unit 20
- 1001 W Lambert Rd Unit 284
- 1001 W Lambert Rd Unit 87
- 1001 W Lambert Rd Unit 146
- 630 W Lambert Rd Unit 24
- 708 W Lambert Rd Unit 6
- 221 Chinchilla St
- 401 Buena Vista Ave
- 531 S Euclid St
- 132 W Mountain View Ave
- 525 S Euclid St Unit 2
- 525 S Euclid St
- 601 S Euclid St Unit 2
- 601 S Euclid St
- 601 S Euclid St Unit 9
- 601 S Euclid St Unit 13
- 601 S Euclid St Unit 10
- 601 S Euclid St Unit 20
- 601 S Euclid St Unit 2A
- 601 S Euclid St Unit 5
- 601 S Euclid St Unit A
- 601 S Euclid St Unit 3A
- 601 S Euclid St Unit 14
- 601 S Euclid St Unit 16
- 601 S Euclid St Unit 17
- 601 S Euclid St Unit 19
- 601 S Euclid St Unit 18
- 601 S Euclid St Unit 6