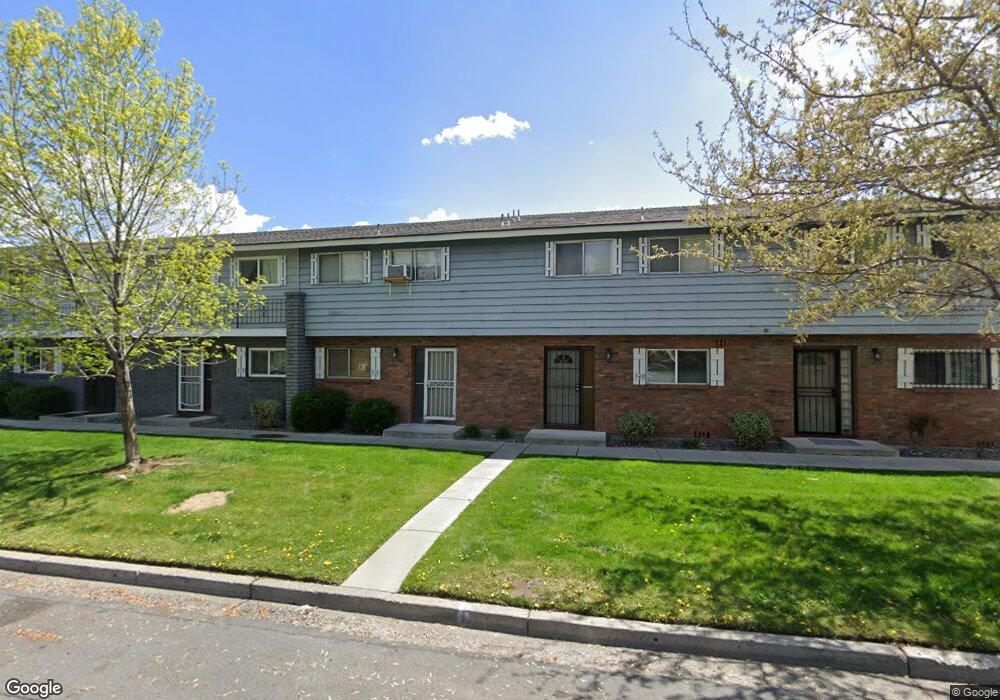
539 Smithridge Park Unit 1 Reno, NV 89502
Smithridge NeighborhoodEstimated Value: $285,689 - $296,000
2
Beds
2
Baths
1,220
Sq Ft
$238/Sq Ft
Est. Value
About This Home
This home is located at 539 Smithridge Park Unit 1, Reno, NV 89502 and is currently estimated at $290,922, approximately $238 per square foot. 539 Smithridge Park Unit 1 is a home located in Washoe County with nearby schools including Smithridge Elementary School, Edward L Pine Middle School, and Damonte Ranch High School.
Ownership History
Date
Name
Owned For
Owner Type
Purchase Details
Closed on
Nov 23, 2020
Sold by
Lyons William and Estate Of Uwana Denise Moyer A
Bought by
Brown Mark Lawrence
Current Estimated Value
Purchase Details
Closed on
Dec 12, 2002
Sold by
Allen Ronald D
Bought by
Allen Ronald D and Allen Uwana D
Home Financials for this Owner
Home Financials are based on the most recent Mortgage that was taken out on this home.
Original Mortgage
$69,944
Interest Rate
6.06%
Mortgage Type
FHA
Purchase Details
Closed on
Oct 6, 1995
Sold by
Morse Landon William Lee and Morse Landon Peggy
Bought by
Allen Ronald D
Home Financials for this Owner
Home Financials are based on the most recent Mortgage that was taken out on this home.
Original Mortgage
$67,688
Interest Rate
7.59%
Mortgage Type
FHA
Create a Home Valuation Report for This Property
The Home Valuation Report is an in-depth analysis detailing your home's value as well as a comparison with similar homes in the area
Home Values in the Area
Average Home Value in this Area
Purchase History
| Date | Buyer | Sale Price | Title Company |
|---|---|---|---|
| Brown Mark Lawrence | -- | None Available | |
| Allen Ronald D | $69,944 | Founders Title Co | |
| Allen Ronald D | $68,000 | First American Title Co |
Source: Public Records
Mortgage History
| Date | Status | Borrower | Loan Amount |
|---|---|---|---|
| Previous Owner | Allen Ronald D | $69,944 | |
| Previous Owner | Allen Ronald D | $67,688 |
Source: Public Records
Tax History Compared to Growth
Tax History
| Year | Tax Paid | Tax Assessment Tax Assessment Total Assessment is a certain percentage of the fair market value that is determined by local assessors to be the total taxable value of land and additions on the property. | Land | Improvement |
|---|---|---|---|---|
| 2025 | $2,351 | $40,367 | $26,075 | $14,292 |
| 2024 | $2,351 | $38,494 | $24,045 | $14,449 |
| 2023 | $3,966 | $35,828 | $23,380 | $12,448 |
| 2022 | $710 | $28,869 | $18,375 | $10,494 |
| 2021 | $658 | $23,171 | $12,915 | $10,256 |
| 2020 | $616 | $23,009 | $12,880 | $10,129 |
| 2019 | $587 | $21,467 | $11,235 | $10,232 |
| 2018 | $562 | $17,697 | $7,350 | $10,347 |
| 2017 | $538 | $17,661 | $7,035 | $10,626 |
| 2016 | $525 | $16,695 | $5,460 | $11,235 |
| 2015 | $525 | $15,826 | $4,095 | $11,731 |
| 2014 | $504 | $14,884 | $3,815 | $11,069 |
| 2013 | -- | $13,237 | $2,520 | $10,717 |
Source: Public Records
Map
Nearby Homes
- 542 Smithridge Park Unit 542
- 528 Smithridge Park Unit 528
- 562 Smithridge Park
- 486 Smithridge Park Unit 5
- 419 Smithridge Park
- 4941 Catalina Dr Unit 2
- 387 Smithridge Park
- 385 Smithridge Park Unit 3UT4LT
- 165 Smithridge Park
- 745 Jamaica Ave Unit 4
- 4604 Neil Rd Unit 141
- 4604 Neil Rd Unit 142
- 710 Jamaica Ave Unit 4
- 5030 Neil Rd Unit 2
- 4600 Neil Rd Unit 35
- 4600 Neil Rd Unit 33
- 4602 Neil Rd Unit 58
- 4608 Neil Rd Unit 226
- 4608 Neil Rd Unit 241
- 277 Smithridge Park
- 540 Smithridge Park Unit 540
- 538 Smithridge Park Unit 538
- 541 Smithridge Park Unit 1
- 537 Smithridge Park
- 536 Smithridge Park Unit 536
- 535 Smithridge Park
- 534 Smithridge Park Unit 534
- 585 Smithridge Park
- 543 Smithridge Park
- 582 Smithridge Park Unit 582
- 583 Smithridge Park Unit 583
- 581 Smithridge Park
- 580 Smithridge Park Unit 580
- 544 Smithridge Park Unit 544
- 584 Smithridge Park Unit 584
- 579 Smithridge Park
- 578 Smithridge Park Unit 578
- 580 Smithridge Dr
- 545 Smithridge Park Unit 545
- 533 Smithridge Park Unit 587