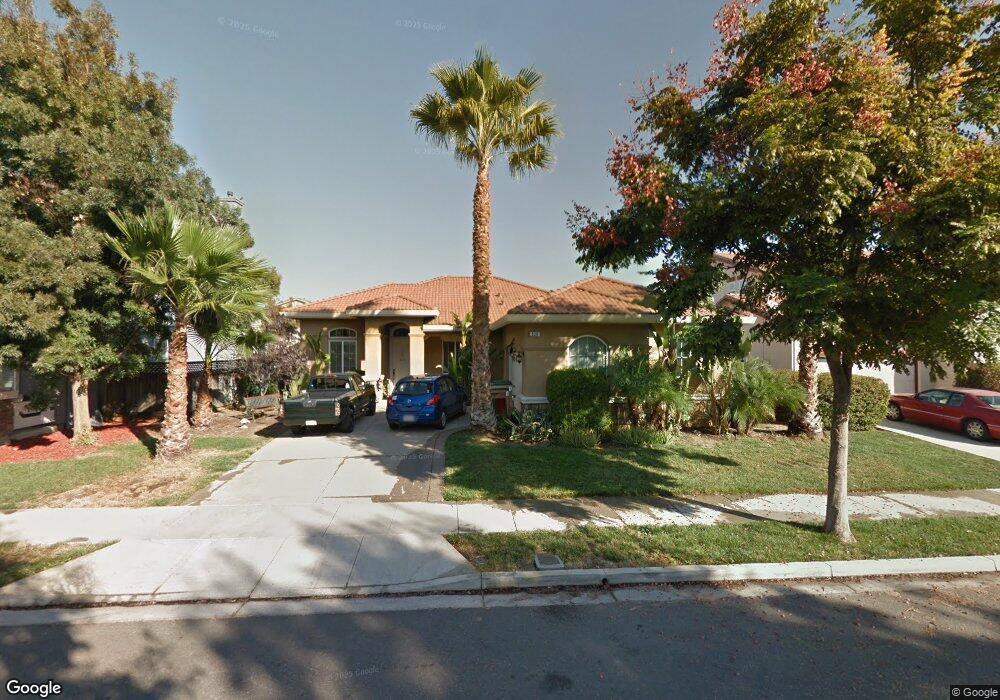
539 Vivian St Brentwood, CA 94513
Brentwood Center NeighborhoodEstimated Value: $727,000 - $785,000
3
Beds
2
Baths
1,938
Sq Ft
$390/Sq Ft
Est. Value
About This Home
This home is located at 539 Vivian St, Brentwood, CA 94513 and is currently estimated at $755,790, approximately $389 per square foot. 539 Vivian St is a home located in Contra Costa County with nearby schools including Mary Casey Black Elementary School, Edna Hill Middle School, and Liberty High School.
Ownership History
Date
Name
Owned For
Owner Type
Purchase Details
Closed on
Dec 4, 2024
Sold by
Gebotsreiber Lidylia A
Bought by
Gebotsreiber Family 1997 Trust and Gebotsreiber
Current Estimated Value
Purchase Details
Closed on
Jul 10, 2007
Sold by
Thomas Richard and Thomas Jennifer
Bought by
Gebotsreiber Lidylia A
Home Financials for this Owner
Home Financials are based on the most recent Mortgage that was taken out on this home.
Original Mortgage
$85,000
Interest Rate
6.51%
Mortgage Type
Purchase Money Mortgage
Purchase Details
Closed on
Jan 6, 2006
Sold by
Signature At Cedarwood
Bought by
Thomas Richard and Thomas Jennifer
Home Financials for this Owner
Home Financials are based on the most recent Mortgage that was taken out on this home.
Original Mortgage
$421,520
Interest Rate
7.5%
Mortgage Type
Fannie Mae Freddie Mac
Create a Home Valuation Report for This Property
The Home Valuation Report is an in-depth analysis detailing your home's value as well as a comparison with similar homes in the area
Home Values in the Area
Average Home Value in this Area
Purchase History
| Date | Buyer | Sale Price | Title Company |
|---|---|---|---|
| Gebotsreiber Family 1997 Trust | -- | None Listed On Document | |
| Gebotsreiber Family 1997 Trust | -- | None Listed On Document | |
| Gebotsreiber Lidylia A | $475,000 | Old Republic Title Company | |
| Thomas Richard | $527,000 | Old Republic Title |
Source: Public Records
Mortgage History
| Date | Status | Borrower | Loan Amount |
|---|---|---|---|
| Previous Owner | Gebotsreiber Lidylia A | $85,000 | |
| Previous Owner | Thomas Richard | $421,520 |
Source: Public Records
Tax History Compared to Growth
Tax History
| Year | Tax Paid | Tax Assessment Tax Assessment Total Assessment is a certain percentage of the fair market value that is determined by local assessors to be the total taxable value of land and additions on the property. | Land | Improvement |
|---|---|---|---|---|
| 2025 | $8,332 | $465,584 | $190,619 | $274,965 |
| 2024 | $8,099 | $456,456 | $186,882 | $269,574 |
| 2023 | $8,099 | $447,507 | $183,218 | $264,289 |
| 2022 | $7,841 | $438,733 | $179,626 | $259,107 |
| 2021 | $7,669 | $430,131 | $176,104 | $254,027 |
| 2019 | $7,682 | $417,376 | $170,882 | $246,494 |
| 2018 | $7,537 | $409,193 | $167,532 | $241,661 |
| 2017 | $7,441 | $401,171 | $164,248 | $236,923 |
| 2016 | $7,089 | $393,306 | $161,028 | $232,278 |
| 2015 | $7,115 | $387,399 | $158,610 | $228,789 |
| 2014 | $6,410 | $329,500 | $134,905 | $194,595 |
Source: Public Records
Map
Nearby Homes