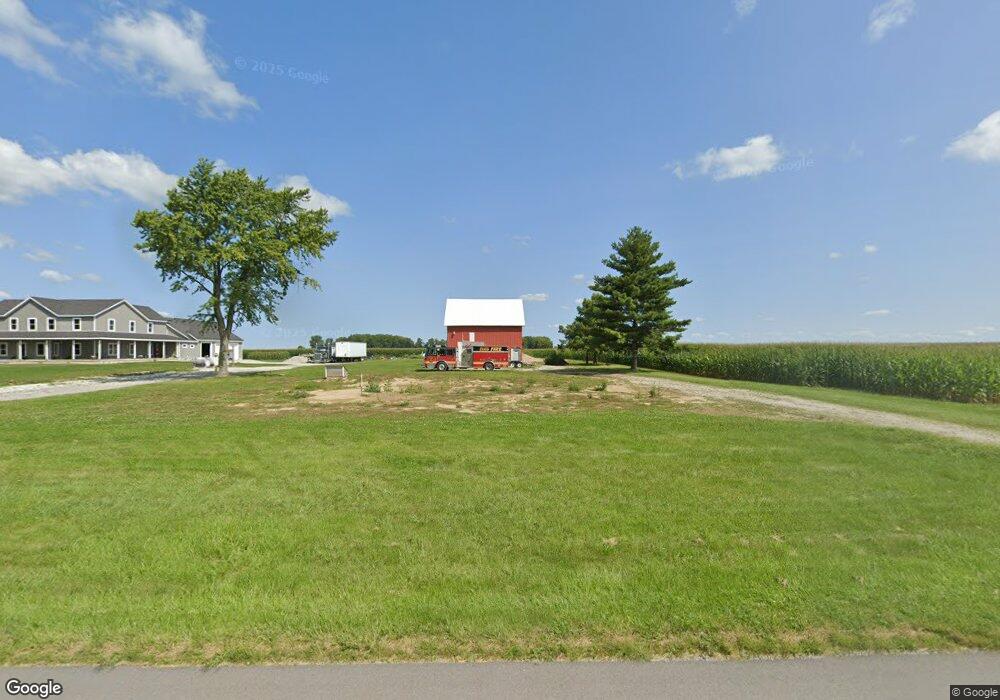
5391 E 200 S Bringhurst, IN 46913
Estimated Value: $321,000 - $682,064
3
Beds
1
Bath
4,690
Sq Ft
$101/Sq Ft
Est. Value
About This Home
This home is located at 5391 E 200 S, Bringhurst, IN 46913 and is currently estimated at $476,021, approximately $101 per square foot. 5391 E 200 S is a home located in Carroll County with nearby schools including Carroll Elementary School and Carroll Senior High School.
Ownership History
Date
Name
Owned For
Owner Type
Purchase Details
Closed on
Jun 17, 2015
Sold by
Arnet David Scott and Arnett Tamie J
Bought by
Miller Cody and Miller Kristen L
Current Estimated Value
Purchase Details
Closed on
Apr 20, 2012
Sold by
Arnett David Scott and Arnett Tamie J
Bought by
Miller Cody and Miller Kristen L
Home Financials for this Owner
Home Financials are based on the most recent Mortgage that was taken out on this home.
Original Mortgage
$30,000
Interest Rate
4%
Purchase Details
Closed on
Mar 22, 2011
Sold by
Federal Home Loan Mortgage Corporation
Bought by
Arnett David Scott and Arnett Tamie J
Purchase Details
Closed on
Sep 29, 2010
Sold by
King Charles A
Bought by
Federal Home Loan Mortgage Corporation
Purchase Details
Closed on
Dec 4, 1998
Sold by
Evans Thomas
Bought by
King Charles
Create a Home Valuation Report for This Property
The Home Valuation Report is an in-depth analysis detailing your home's value as well as a comparison with similar homes in the area
Purchase History
| Date | Buyer | Sale Price | Title Company |
|---|---|---|---|
| Miller Cody | -- | None Available | |
| Miller Cody | $30,000 | None Available | |
| Arnett David Scott | -- | None Available | |
| Federal Home Loan Mortgage Corporation | $99,450 | None Available | |
| King Charles | $102,000 | -- |
Source: Public Records
Mortgage History
| Date | Status | Borrower | Loan Amount |
|---|---|---|---|
| Previous Owner | Miller Cody | $30,000 |
Source: Public Records
Tax History
| Year | Tax Paid | Tax Assessment Tax Assessment Total Assessment is a certain percentage of the fair market value that is determined by local assessors to be the total taxable value of land and additions on the property. | Land | Improvement |
|---|---|---|---|---|
| 2025 | $3,071 | $696,200 | $35,600 | $660,600 |
| 2024 | $3,071 | $587,300 | $35,600 | $551,700 |
| 2023 | $4,917 | $596,000 | $35,600 | $560,400 |
| 2022 | $3,280 | $504,300 | $34,900 | $469,400 |
| 2021 | $3,119 | $445,900 | $34,900 | $411,000 |
| 2020 | $2,560 | $364,100 | $34,900 | $329,200 |
| 2019 | $2,503 | $334,900 | $34,900 | $300,000 |
| 2018 | $611 | $33,000 | $33,000 | $0 |
| 2017 | $656 | $132,700 | $33,000 | $99,700 |
| 2016 | $568 | $120,200 | $33,000 | $87,200 |
| 2014 | $378 | $108,100 | $29,800 | $78,300 |
Source: Public Records
Map
Nearby Homes
Your Personal Tour Guide
Ask me questions while you tour the home.