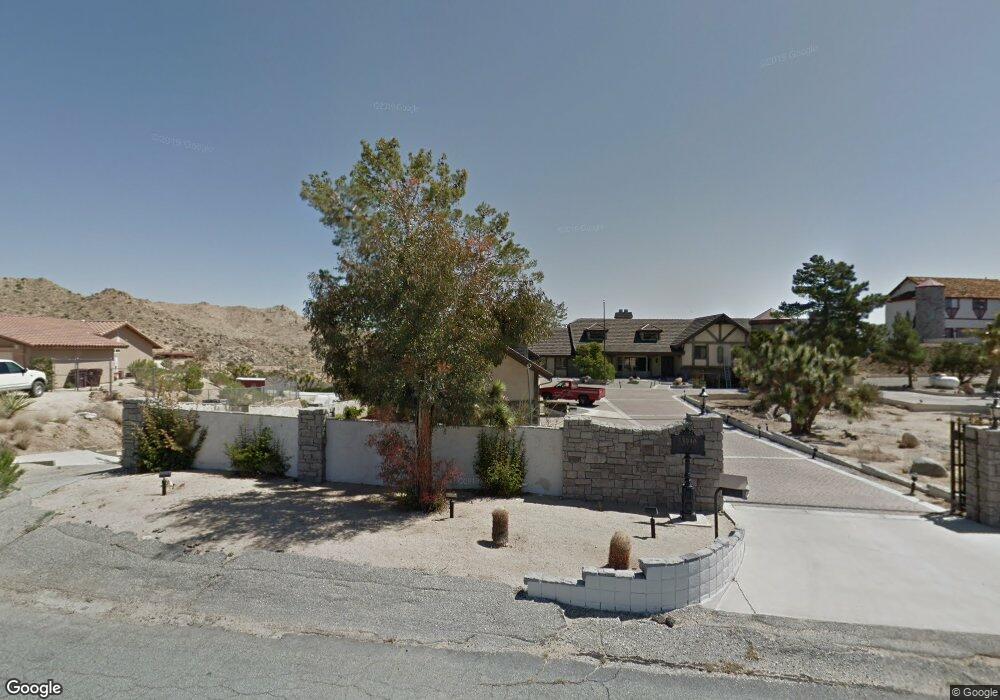
53910 Ridge Rd Yucca Valley, CA 92284
Estimated Value: $2,632,000 - $2,856,000
10
Beds
14
Baths
9,031
Sq Ft
$305/Sq Ft
Est. Value
About This Home
This home is located at 53910 Ridge Rd, Yucca Valley, CA 92284 and is currently estimated at $2,751,182, approximately $304 per square foot. 53910 Ridge Rd is a home located in San Bernardino County with nearby schools including Yucca Valley Elementary School, La Contenta Middle School, and Yucca Valley High School.
Ownership History
Date
Name
Owned For
Owner Type
Purchase Details
Closed on
Mar 23, 2011
Sold by
U S Bank National Association
Bought by
Paul Frank A
Current Estimated Value
Purchase Details
Closed on
Jan 29, 2010
Sold by
Corum Curtis
Bought by
U S Bank National Association
Purchase Details
Closed on
Jan 4, 2010
Sold by
Corum Curtis
Bought by
Us Bank National Association Nd
Purchase Details
Closed on
Feb 2, 2006
Sold by
All Nations Christian Center
Bought by
Corum Curtis
Home Financials for this Owner
Home Financials are based on the most recent Mortgage that was taken out on this home.
Original Mortgage
$750,000
Interest Rate
6.12%
Mortgage Type
Purchase Money Mortgage
Create a Home Valuation Report for This Property
The Home Valuation Report is an in-depth analysis detailing your home's value as well as a comparison with similar homes in the area
Home Values in the Area
Average Home Value in this Area
Purchase History
| Date | Buyer | Sale Price | Title Company |
|---|---|---|---|
| Paul Frank A | $425,000 | Lawyers Title Co | |
| U S Bank National Association | $629,330 | Lawyers Title | |
| Us Bank National Association Nd | $270,564 | Accommodation | |
| Corum Curtis | $1,400,000 | Southland Title |
Source: Public Records
Mortgage History
| Date | Status | Borrower | Loan Amount |
|---|---|---|---|
| Previous Owner | Corum Curtis | $750,000 |
Source: Public Records
Tax History Compared to Growth
Tax History
| Year | Tax Paid | Tax Assessment Tax Assessment Total Assessment is a certain percentage of the fair market value that is determined by local assessors to be the total taxable value of land and additions on the property. | Land | Improvement |
|---|---|---|---|---|
| 2025 | $6,973 | $544,501 | $89,682 | $454,819 |
| 2024 | $6,973 | $533,825 | $87,924 | $445,901 |
| 2023 | $6,728 | $523,358 | $86,200 | $437,158 |
| 2022 | $6,455 | $513,096 | $84,510 | $428,586 |
| 2021 | $5,917 | $503,035 | $82,853 | $420,182 |
| 2020 | $5,885 | $497,877 | $82,003 | $415,874 |
| 2019 | $6,226 | $488,115 | $80,395 | $407,720 |
| 2018 | $5,960 | $478,544 | $78,819 | $399,725 |
| 2017 | $5,801 | $469,161 | $77,274 | $391,887 |
| 2016 | $5,695 | $459,962 | $75,759 | $384,203 |
| 2015 | $5,567 | $453,053 | $74,621 | $378,432 |
| 2014 | $5,518 | $444,178 | $73,159 | $371,019 |
Source: Public Records
Map
Nearby Homes
- 53935 Ridge Rd
- 54001 Ridge Rd
- 53988 Pinon Dr
- 54045 Ridge Rd
- 7495 Canyon Dr
- 0 Pinon Dr Unit JT25040803
- 0 Ridge Rd Unit 25007496
- 54260 Pinon Dr
- 54129 Pinon Dr
- 7615 Ventura Ave
- 0 Shafter Ave Unit 219132119DA
- 54424 Pinon Dr
- 0 29 Palms Hwy Unit SR25199988
- 040 Whitney Ave
- 7575 Whitney Ave
- 7587 Rockaway Ave
- 7616 Fairway Dr
- 7695 Rockaway Ave
- 0 585-271- Fairway Dr
- 7515 Pinon Dr